Usage analytics
Aggregating raw activity into trends, comparisons, and breakdowns.
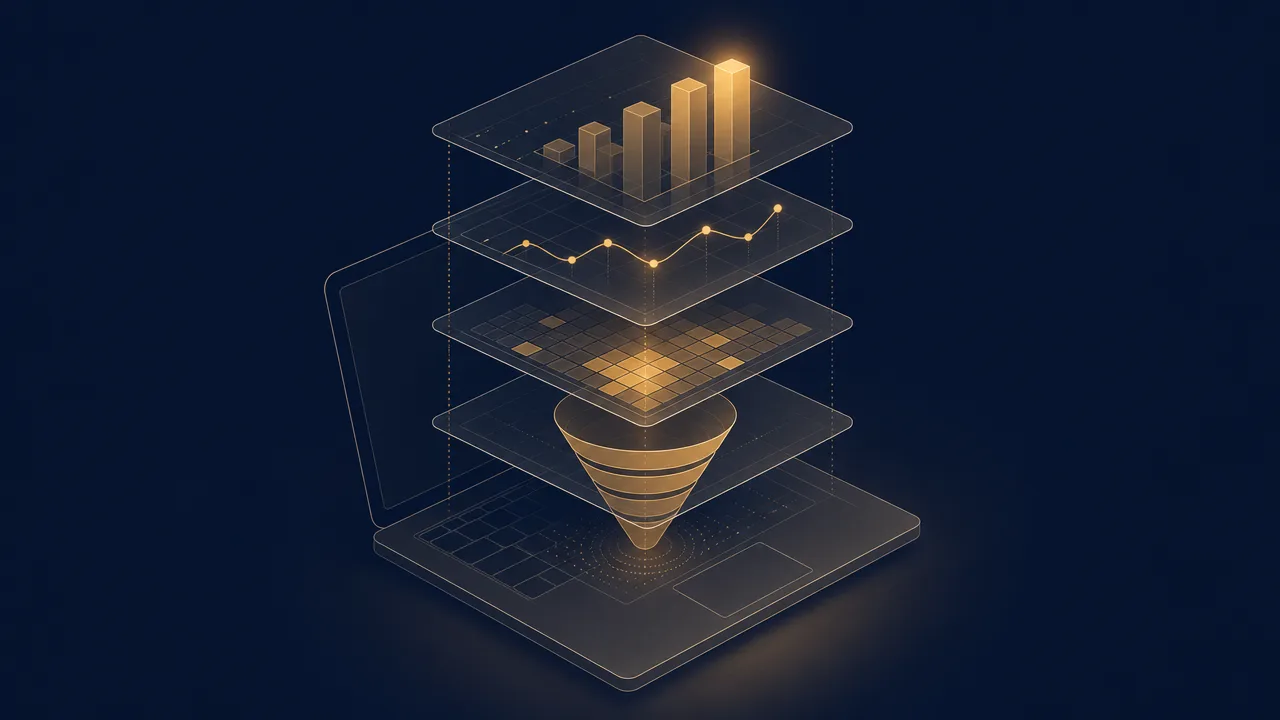
Usage analytics is the layer that sits directly above raw activity tracking. Where activity tracking records the events themselves, usage analytics aggregates them into something a human can read: a trend over weeks, a breakdown by application, a comparison against last month, a funnel from one step to the next. It is the difference between a log file and a chart.
The term covers two related but distinct practices. Inside software products, teams use platforms like Mixpanel and Amplitude to understand how many people use which features. On personal computers, tools like RescueTime and WhatPulse use similar techniques to describe how one person spends time across many applications. This page covers both.
What is usage analytics?
Usage analytics is the discipline of turning streams of usage events into structured summaries. The inputs are individual records: someone opened the editor at 09:14, clicked save at 09:21, switched to the browser at 09:23. The outputs are aggregates: minutes per application, sessions per day, share of time in each category, week-over-week change.
The unit of analysis varies by context. Product analytics platforms describe many users interacting with one product. Personal computer analytics describes one user interacting with many applications. The underlying mathematics is the same; the questions are not.
What usage analytics is not is a measure of value. It can describe what happened with high precision and still tell you nothing about whether the activity was useful. That interpretive layer has to come from somewhere else: a definition of productive work, a business goal, a personal intent.
Why does usage analytics matter?
Raw activity data is too dense to act on. A single working day produces thousands of input events and dozens of foreground-application transitions. Usage analytics turns that noise into signal by collapsing time and counting categories, which is what makes any of it useful.
For product teams, analytics is how feature decisions get made. Which features do new users find in their first week? Where do trial users abandon the funnel? Mixpanel, Amplitude, and similar platforms exist because guessing at these questions is expensive and the answers tend to be counterintuitive.
For individuals, usage analytics provides a check against memory. Self-reports of how a workweek was spent are biased toward the most recent and most vivid moments. An honest breakdown of where hours actually went is almost always at least mildly surprising.
For managers, analytics surfaces patterns that no single employee can see. Team-level breakdowns can show how tools are really adopted and where the working day is eaten by switching. Used as a leaderboard, it tends to corrupt the signal it relies on.
How is usage analytics produced?
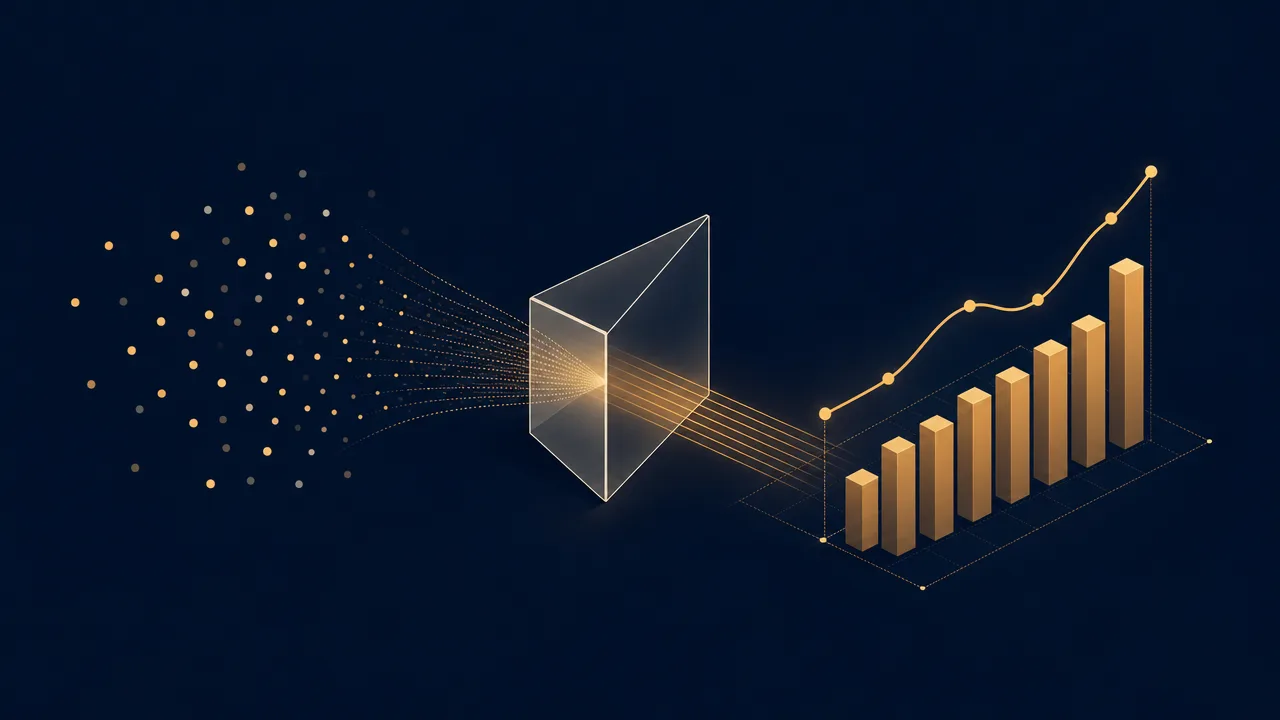
Producing usage analytics from raw activity involves a handful of consistent steps. The names vary between tools; the substance is similar.
The first step is aggregation. Individual events are grouped by some dimension, usually a combination of user or device, application or feature, and time. Counts, durations, and unique-user totals are computed for each group. This is what turns a stream of clicks into a row that says "Editor: 2h 14m, 42 sessions".
The second step is time bucketing. Continuous time has to be cut into discrete intervals before it can be charted. Hour, day, week, and month are the common choices, and the choice has a real effect on what the data seems to say. A trend that looks erratic at daily resolution often looks smooth at weekly resolution.
The third step is attribution to categories. Applications get tagged as work, communication, or entertainment. Features get grouped into modules. Events get classified as activation, engagement, or retention signals. Categories are where most of the interpretive work happens.
The fourth step is comparison against a baseline. A number on its own is rarely interesting; the same number relative to last week, a peer group, or a goal almost always is. Avinash Kaushik has argued for years that segmentation is the main route from aggregated data to actionable insight, on the basis that raw aggregates hide more than they reveal.
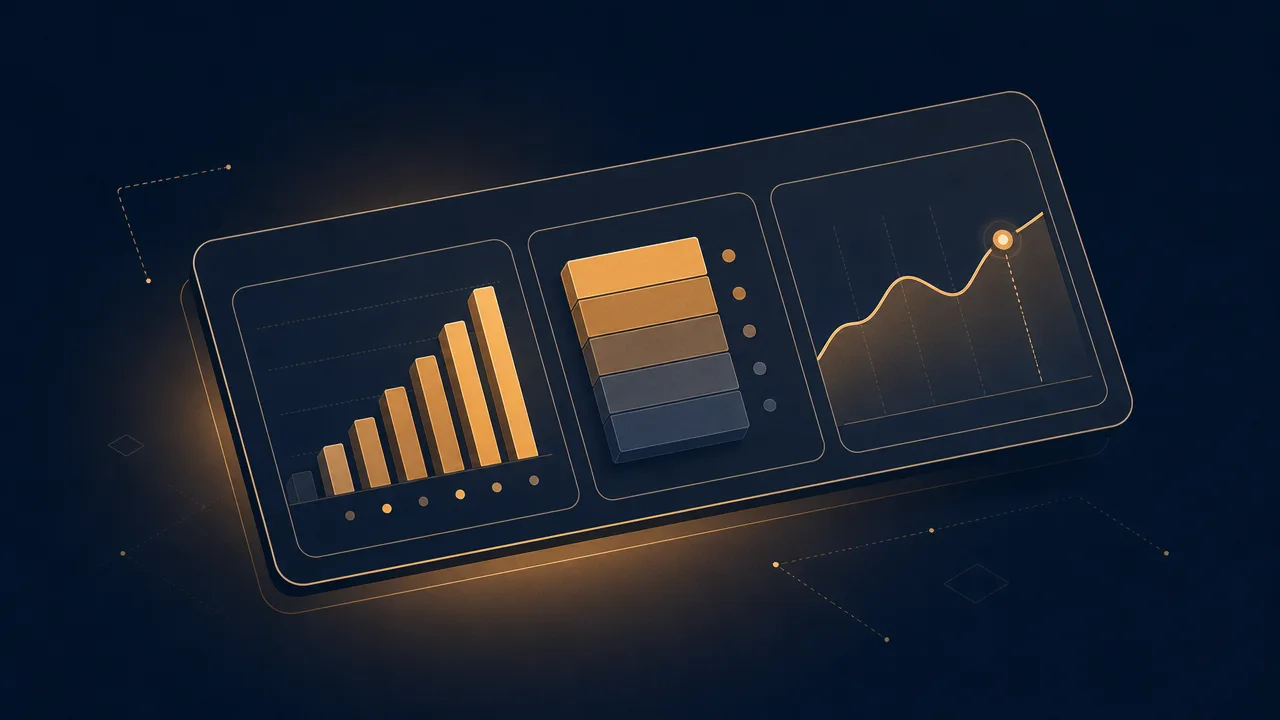
The fifth step is visualisation. Bar charts, line charts, heatmaps, funnels, and cohort grids all exist because different shapes of data demand different shapes of chart. A good usage-analytics surface chooses charts that match the question.
Common benchmarks
There is no single standard for what a usage-analytics setup should contain, because the right setup depends on what is being analysed. Product analytics for a consumer mobile app looks very different from personal analytics for a knowledge worker. A few patterns recur often enough to be worth naming.
In product analytics, the AARRR framework introduced by Dave McClure in 2007 organises metrics into five lifecycle stages: acquisition, activation, retention, referral, and revenue. Common KPIs derived from it include activation rate, weekly active users, retention curves, feature adoption rate, and time to first value.
In web analytics, Avinash Kaushik has argued that the most useful KPIs depend on the size and intent of the site, but that segmentation by acquisition source, behaviour, and outcome is nearly always more informative than headline totals.
In personal computer analytics, the typical KPIs are simpler: daily active time, share of time per category, longest focus session, share of foreground time in the top three applications, week-over-week change. These are benchmarks against the same person's previous behaviour, which is usually the only fair comparison.
The most important distinction between product analytics and personal analytics is the unit of aggregation. Product analytics aggregates across users; personal analytics aggregates across time. A KPI from one rarely makes direct sense in the other.
Examples
A few worked examples show how usage analytics behaves in practice.
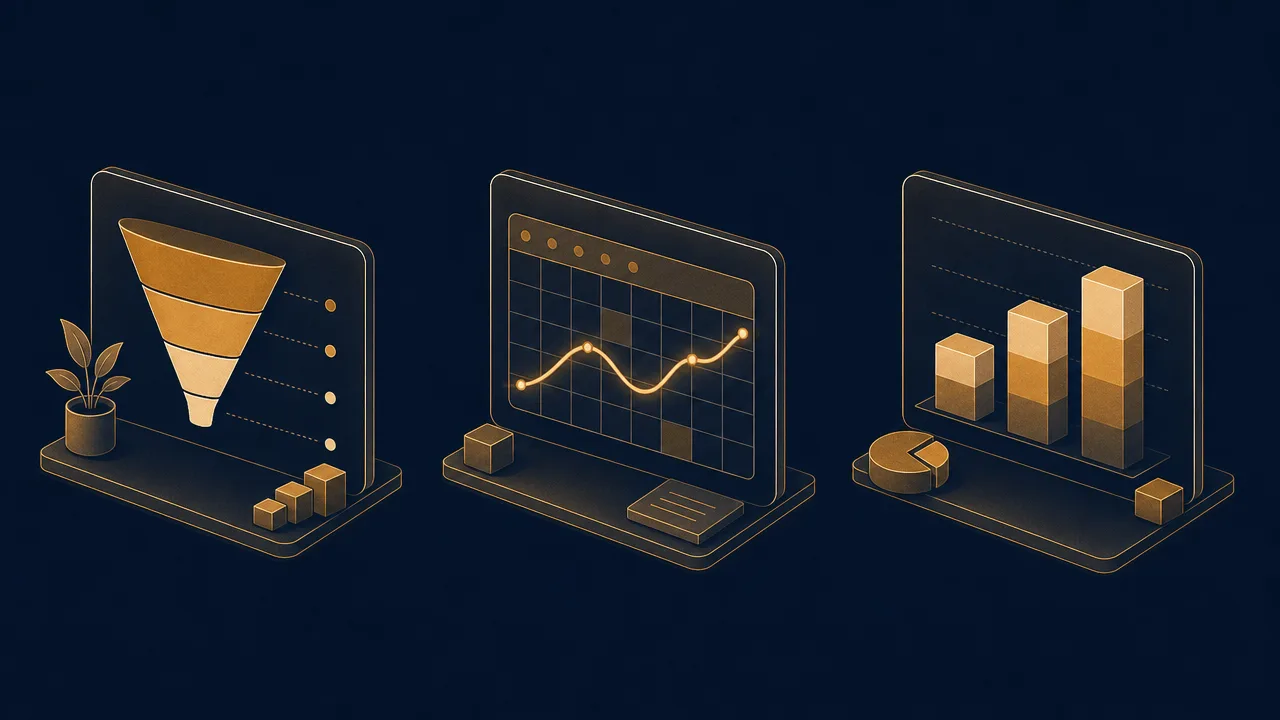
A product analyst at a note-taking startup is examining adoption of a new tagging feature. They aggregate by user, bucket by day, attribute events to the new feature, and visualise the result as a retention cohort. The chart shows that a portion of users who tried tagging in week one are still using it in week four. The number alone is just data; the comparison against prior feature launches is what makes it a decision.
A personal user is reviewing their monthly trend on a tool like WhatPulse. They notice the second half of every week reliably shows a drop in time spent in their editor and a rise in time spent in chat. The pattern is what is interesting, because it implies meetings cluster later in the week and focused work is structurally pushed into Mondays and Tuesdays.
A team manager comparing app-mix across a small team aggregates per-person data into team totals, keeping individual breakdowns out of the shared dashboard. They notice the team collectively spends more time in the project-management tool than expected. The right next step is to ask why that tool has become so demanding, because the analytics has surfaced a structural question, not a personal one.
Misconceptions
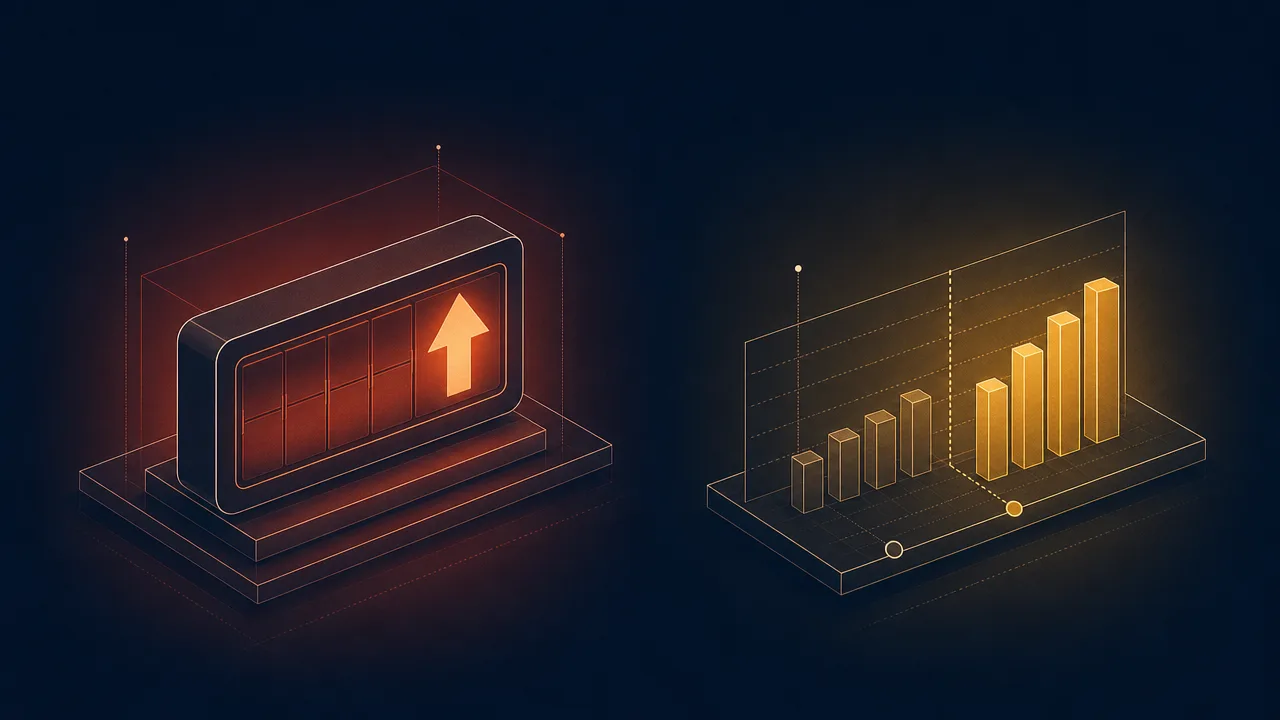
The most common misconception is that aggregate numbers describe individual experience. Population averages routinely hide enormous variance. A median session length of twenty minutes is consistent with most users having twenty-minute sessions, and equally consistent with half having five-minute sessions and the other half having hour-long sessions. Aggregates without distributions are easy to misread.
A second persistent error is treating correlation as causation. If feature adoption rises the same week a campaign launches, the campaign may have caused it, both may share an underlying cause, or the timing may be coincidence. Usage analytics is excellent at surfacing correlations and silent on causes. Concluding cause from a chart usually requires a controlled experiment.
A third misconception is that the biggest numbers on the dashboard are the most important. Eric Ries coined the term vanity metrics for headline figures like total registered users and cumulative downloads that grow regardless of what the team does. Actionable metrics, by contrast, are ones where a clear cause-and-effect link makes it obvious what to do next.
Related concepts
Usage analytics is the connective tissue between several adjacent ideas. The ones that show up most often:
- Activity tracking: the raw event capture that usage analytics sits on top of.
- Activity trends: usage-analytics views that focus on change over time rather than levels.
- Usage distribution: how time or events spread across applications, features, or categories.
- Application usage: the per-application breakdown that drives most personal-analytics dashboards.
- Productivity metrics: interpretive scores layered on top of raw usage analytics.
- Active time: a foundational input metric used in nearly every usage-analytics surface.
- Focus time: a derived metric describing continuous, single-application active periods.
- Context switching: a usage-analytics view that counts foreground-application transitions.
- Session length: the duration of a single continuous use session, summarised across time.
Tracking with usage analytics
A usable personal usage-analytics setup needs three things: a reliable source of raw events, usually operating-system signals for input and foreground application; an aggregation layer that buckets those events by time and category; and a small set of comparison views that put current numbers in context against history. Most personal analytics tools collapse those layers into a single application with a dashboard.
WhatPulse is one example of this pattern. It runs locally on Windows, macOS, and Linux, captures the raw events on the device, and produces per-application, per-category, and per-day breakdowns of active time, keystrokes, clicks, and network use. The aggregation happens whether or not the device is online. An optional sync to a personal dashboard makes longer trends and cross-device comparisons available.
The aim of running personal usage analytics is not to optimise a score. It is to have an honest, consistent baseline against which to spot drift, surface patterns, and make small adjustments.
Frequently asked questions
What is the difference between usage analytics and activity tracking?
Activity tracking captures the raw events: keystrokes, clicks, app switches, page views. Usage analytics is the layer that aggregates and slices those events into trends, breakdowns, and comparisons that someone can actually act on.
How is product usage analytics different from personal computer usage analytics?
Product usage analytics, in tools like Mixpanel and Amplitude, describes how many users do which things inside one application. Personal computer usage analytics describes how one user spends time across many applications. The methods overlap; the audience and unit of analysis do not.
What are vanity metrics?
Eric Ries used the term to describe numbers that make you feel good but do not drive decisions, like total registered users or cumulative downloads. They tend to go up regardless of what you do, so they cannot tell you whether a change worked.
What is the AARRR framework?
Acquisition, Activation, Retention, Referral, Revenue. Dave McClure proposed it in 2007 as a simple funnel for product usage analytics that forces teams past surface counts and into lifecycle behaviour.
Does usage analytics require sending data to a server?
For product analytics platforms, usually yes, because events from many users have to be combined. For personal computer analytics, the aggregation can happen entirely on the device, with optional sync to a private dashboard for longer trends.
How granular should event tracking be?
Granular enough to answer the questions you actually have, and no more. Capturing every micro-interaction inflates storage costs and dashboard noise without changing decisions. Start from the question, work back to the event.
Is a higher usage number always better?
No. For a productivity tool, more time spent could mean it is sticky or that users cannot find what they need. For a personal tracker, more active hours might reflect overwork rather than output. Context decides whether a number is good news.
Conclusion
Usage analytics is the bridge between raw activity and useful decisions. It aggregates events into trends, slices them into categories, and compares them against a baseline so that a human looking at a chart can see something worth acting on. The methods are similar whether the subject is a product with many users or a computer with one. The questions, and therefore the dashboards, are not.
Done carefully, usage analytics replaces guesswork with patterns and intuition with evidence. Done carelessly, it produces large numbers that feel meaningful but do not change anything. The discipline lives in choosing which numbers to track, which segments to break them by, and which comparisons to take seriously.