Network usage
Inbound and outbound bytes, attributed to apps and time of day.

Network usage is one of the most observable metrics a computer produces, and one of the most misread. It measures the volume of data crossing a machine's network interfaces, split between bytes pulled from the network and bytes sent out to it, and attributed to whichever applications opened the connections in the first place. Almost every operating system, router, and personal analytics tool reports a network number, but what that number includes, and how it is sliced, varies a lot from one source to the next.
This page covers what network usage is, how it is measured at the interface and the process level, what useful benchmarks look like in 2025, the situations where the metric tends to mislead, and the related concepts that sit alongside it in the broader vocabulary of computer activity.
What is network usage?
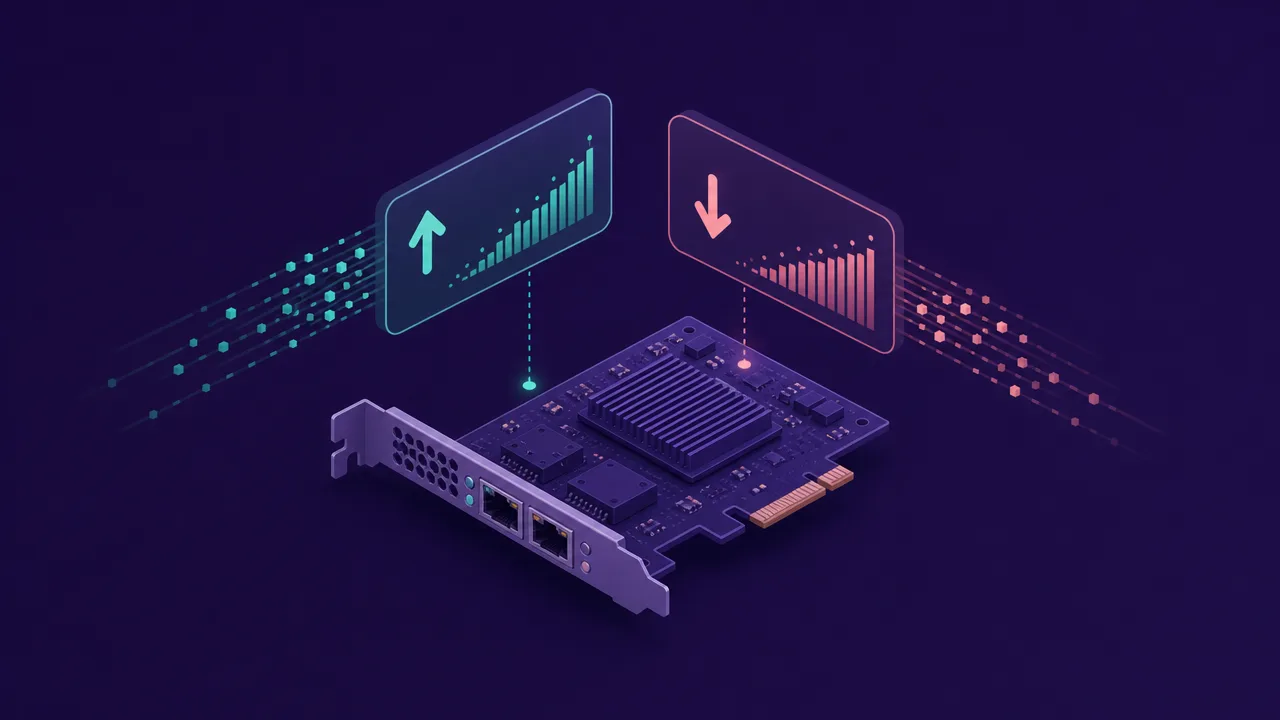
Network usage is the cumulative volume of data transferred over a computer's network interfaces during a given time window. It is normally reported as two numbers: inbound bytes received from the network and outbound bytes sent to it. Trackers refer to these as download and upload, or RX and TX, but the underlying quantity is the same.
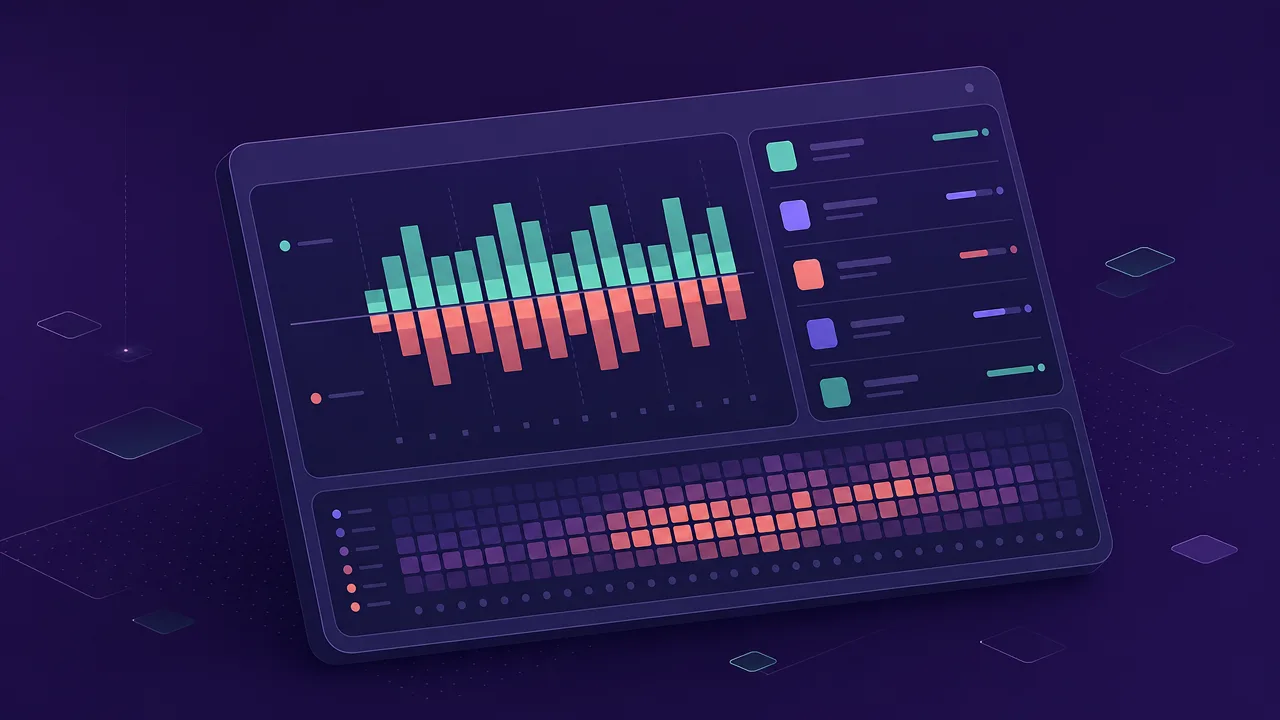
The interesting part is the attribution. Modern operating systems track which process owns each network socket, so the same total bytes can be sliced by application, by category, or by time of day. That allows a single day's network usage to be broken down into, for example, three hours of video calls in a browser, two hours of cloud sync, a forty-gigabyte game patch, and a long tail of small background services.
Network usage is not a measurement of speed, quality, or value. It is a low-level count of bytes crossing an interface. Higher-level interpretations like cost per gigabyte, bandwidth saturation, or cap-overage risk are built on top of that count, but they require the additional context of the connection plan, the interface type, and the time window.
Why does network usage matter?
Network usage matters at the personal level for three practical reasons. It explains where data caps are being spent on connections that have them. It surfaces which applications are quietly running up large transfers in the background, often without any visible interface. And it produces a stable record of which tools actually carry weight in a workday, weighted by what they move rather than how long their windows were open.
At a wider scale, the same signal helps with diagnosis. A connection that feels slow can be slow for many reasons, but a per-application breakdown of the bytes flowing through it usually narrows the list quickly. A large transfer that nobody started points at a sync client or an update agent. A sustained outbound stream points at a backup or a video call. Without per-process attribution, the same investigation tends to stall at "something is using the network".
For people working from home on metered connections, mobile hotspots, or capped plans, network usage is also a budgeting tool. OpenVault's Q2 2025 Broadband Insights report places the average United States subscriber at 664.2 gigabytes per month, of which roughly 615.3 gigabytes is downstream and 48.9 gigabytes is upstream. Once a household crosses into the high-volume tier, knowing where the bytes go becomes a household question rather than a technical one.
How is network usage measured?
Two layers of measurement matter, and they are usually combined. The first is the interface counter. Every operating system maintains a per-interface tally of bytes sent and received at the kernel level. These counters are cheap to read, accurate, and exposed through standard APIs. They give the true total of what crossed the wire, regardless of which application produced it.
The second is per-process attribution. The operating system knows which process opened each socket and how many bytes flowed through it. Trackers sample these mappings periodically and credit each socket's traffic to the owning process. The resulting attribution is precise for long-lived connections, less precise for very short-lived ones that may finish between samples, and ambiguous for traffic routed through shared system services where the original requester is obscured.
Units are the other place confusion creeps in. Network usage is reported in bytes, kilobytes, megabytes, gigabytes, or terabytes, but bandwidth and link speed are reported in bits per second. A hundred megabit connection moves about twelve and a half megabytes per second at full saturation, and a one-gigabit interface moves about a hundred and twenty-five megabytes per second. Mixing the two units routinely produces estimates that are off by a factor of eight in either direction.
A few details are worth knowing. Network usage is normally calculated locally on the device and does not require any external service to be recorded. Multi-interface setups, such as a laptop with both Wi-Fi and ethernet active, are usually tracked per interface and summed only at the reporting layer. Loopback traffic between processes on the same machine is conventionally excluded, since it never leaves the device. And encrypted tunnels like VPNs do not hide the byte count from the local tracker, only the destination from the network in between.
Common benchmarks
Reference points for network usage exist at the household level and at the per-activity level. They are useful as sanity checks rather than as targets, because individual usage varies by an order of magnitude depending on streaming habits, working patterns, and household size.
- Average United States broadband subscribers consumed about 664 gigabytes per month in the second quarter of 2025, growing roughly 13 percent year over year, according to OpenVault's Broadband Insights report. The 90th-percentile household consumed over two terabytes per month.
- Netflix publishes a guideline of about 3 gigabytes per hour for 1080p streaming and about 7 gigabytes per hour for 4K. Independent testing of 4K HDR content has measured up to around 11 gigabytes per hour for action-heavy scenes.
- Zoom one-on-one video at standard high quality uses roughly 540 megabytes per hour, rising to about 1.6 gigabytes per hour at 1080p. Group video calls run higher, in the range of 1 to 2.5 gigabytes per hour, broadly comparable to Microsoft Teams and Google Meet at similar quality.
- Single Call of Duty seasonal patches on PC have routinely run 50 gigabytes or more in 2024 and 2025, with Black Ops 6 Season 3 measured at about 52 gigabytes on Steam. A single major patch can equal a week of a household's video streaming.
- Sandvine's Global Internet Phenomena reporting places on-demand video streaming at roughly half of global downstream traffic by volume, with a handful of large providers accounting for the majority of the rest. Personal network usage on a typical home connection tends to reflect those same ratios.
These figures are aggregates and headline numbers. The right comparison for any one person is almost always their own trend over time, not the population average.

Examples
A few worked examples illustrate how the metric behaves in practice.
A remote worker spends a typical day in five hours of video meetings across Zoom and Teams, mostly at standard quality with cameras on. At roughly 1 gigabyte per hour averaged across one-on-one and group calls, that single activity adds about 5 gigabytes inbound and a comparable 5 gigabytes outbound, since video calls are one of the few common activities where upload and download are roughly balanced. Add cloud sync, email, and browsing, and the day lands somewhere between 12 and 20 gigabytes total.
A gamer installing a new title and pulling that week's patches sees a single transfer in the range of 50 to 150 gigabytes inbound, in one afternoon, with almost no upload. A network-usage breakdown will show one application accounting for nearly all the day's downstream traffic and the rest of the machine producing a small constant background. A 1-terabyte monthly cap can be spent on three or four such days.
A family streaming a long evening together moves predictable volumes. Two hours of 4K Netflix on the living-room screen runs about 14 gigabytes. A separate device on 1080p adds about 3 gigabytes per hour. Background app updates and a smart-home camera uploading clips contribute a few additional gigabytes. The aggregate is dominated by inbound video, with a small but steady outbound stream from cameras and call audio.

Misconceptions
The most persistent misconception is that bandwidth and network usage are the same thing. Bandwidth is a rate, expressed in bits per second; network usage is a volume, expressed in bytes over a window. A faster connection does not consume more bytes on its own. It only changes how quickly the same transfer completes. Most data-cap surprises come from this confusion, with people upgrading their speed and expecting the cap to stretch with it.
A second common error is assuming that upload and download are symmetric. For most home users they are heavily asymmetric. A typical browsing or streaming day produces ten to twenty times more download than upload. Video calls, cloud backup, and peer-to-peer transfers are the main exceptions, and they are also the activities most likely to feel slow on connections sold primarily on download speed.
A third misconception is that network usage only counts the things you actively did. In practice, a meaningful share of any modern household's bytes is moved by background processes. System updates, cloud sync, telemetry, app updates, and ambient services like smart-home cameras add up to several gigabytes a day in many setups, even before the user opens a browser. Per-application breakdowns tend to surface these quietly.
Related concepts
Network usage sits inside a small cluster of closely related metrics. Reading it well usually means reading the others alongside it.
- Bandwidth: the maximum rate at which the connection can move data, expressed in bits per second.
- Application usage: the per-application breakdown of time and bytes, which network usage feeds into.
- Foreground application: the app currently in focus, which often differs from the app moving the most bytes.
- Usage distribution: how a day's network bytes split across applications, categories, or hours.
- Usage analytics: longitudinal patterns in network usage and other tracked signals.
- Active time: when the user was providing input, useful for separating user-driven traffic from background traffic.
- Idle time: stretches with no input, during which much background network activity actually happens.
- Uptime: how long the machine has been powered on, which sets the ceiling on possible background traffic.
- Activity tracking: the broader category of measuring computer behaviour, of which network usage is one signal.
- Activity trends: month-over-month and year-over-year changes in volumes such as bytes transferred.
Tracking network usage
Network usage can be tracked at the operating-system level by any application with permission to read interface counters and per-process socket information. WhatPulse is one such application: it runs locally on Windows, macOS, and Linux, records inbound and outbound bytes per interface, and attributes those bytes to the application that opened each connection. The user can inspect that data per application, per day, and over longer periods.
Because the recording happens on the device, no network connection to an external service is required for the underlying measurement. The interface counters are read locally, the per-process attribution is resolved locally, and the totals are stored locally. Users can keep the data purely local or sync it to a personal dashboard for trend analysis across machines and months.
The point of measuring network usage in this context is not to police a connection or to chase a number toward zero. It is to give a stable, honest record of where the bytes actually went, so that the surprising parts, the quiet background transfers, the patches that ate a week's cap, the sync clients that never quite stop, become visible instead of invisible.
Frequently asked questions
Is network usage the same as bandwidth?
No. Bandwidth is the maximum rate at which data can be transferred, measured in bits per second. Network usage is the cumulative volume of data actually transferred, measured in bytes over a time window.
Why is my upload so much smaller than my download?
Most consumer activity is asymmetric. Streaming, browsing, and downloading patches all pull large volumes from servers while sending only small acknowledgements back. Outbound traffic only catches up when you join video calls, back up files, or seed peer-to-peer transfers.
Does network usage count local traffic on my LAN?
It depends on the tool. Most trackers report traffic on the active network interface, which includes LAN transfers such as syncing to a NAS or streaming to another device in the house. Some tools let you filter local traffic out separately.
How is per-application network usage attributed?
The operating system knows which process opened each socket. Trackers query that mapping and credit the bytes flowing through the socket to the owning application. Traffic from system services or background daemons is attributed to those processes rather than to user-facing apps.
Does a VPN change my recorded network usage?
A VPN routes traffic through an encrypted tunnel, but the underlying interface still reports the same byte volume, often slightly higher because of encryption overhead. The tracker sees the bytes, even if the destination is hidden.
Why does my network usage spike when the computer is idle?
Background updates, cloud sync, telemetry, and backup tools all run independently of user input. They commonly produce the largest single transfers of the day, often overnight, with no foreground application involved.
Is network usage tracked locally or in the cloud?
The measurement happens on the device, by reading interface counters that the operating system already maintains. No external service is required to record the data. Some tools then sync the totals to an account for trend analysis.
How accurate are per-application byte counts?
On modern operating systems they are accurate to within a small percentage. The main sources of drift are short-lived processes that finish before the tracker can sample them and traffic routed through shared system services that obscure the original owner.
Conclusion
Network usage is a precise measurement of a narrow thing: how many bytes crossed the network interfaces during a window, attributed to the applications that moved them. It is the foundation for almost every higher-level question about a connection, from cost and capacity to which tools quietly dominate the day. The number itself is reliable when read with care, and badly misleading when confused with bandwidth or treated as a measure of how hard the user was working.
Treated as a long-running record, compared against a person's own history, and paired with application usage, active time, and time-of-day breakdowns, network usage is one of the more useful numbers a computer-activity tracker produces.