Mouse heatmap
A visual map of where the cursor and clicks accumulate on screen.
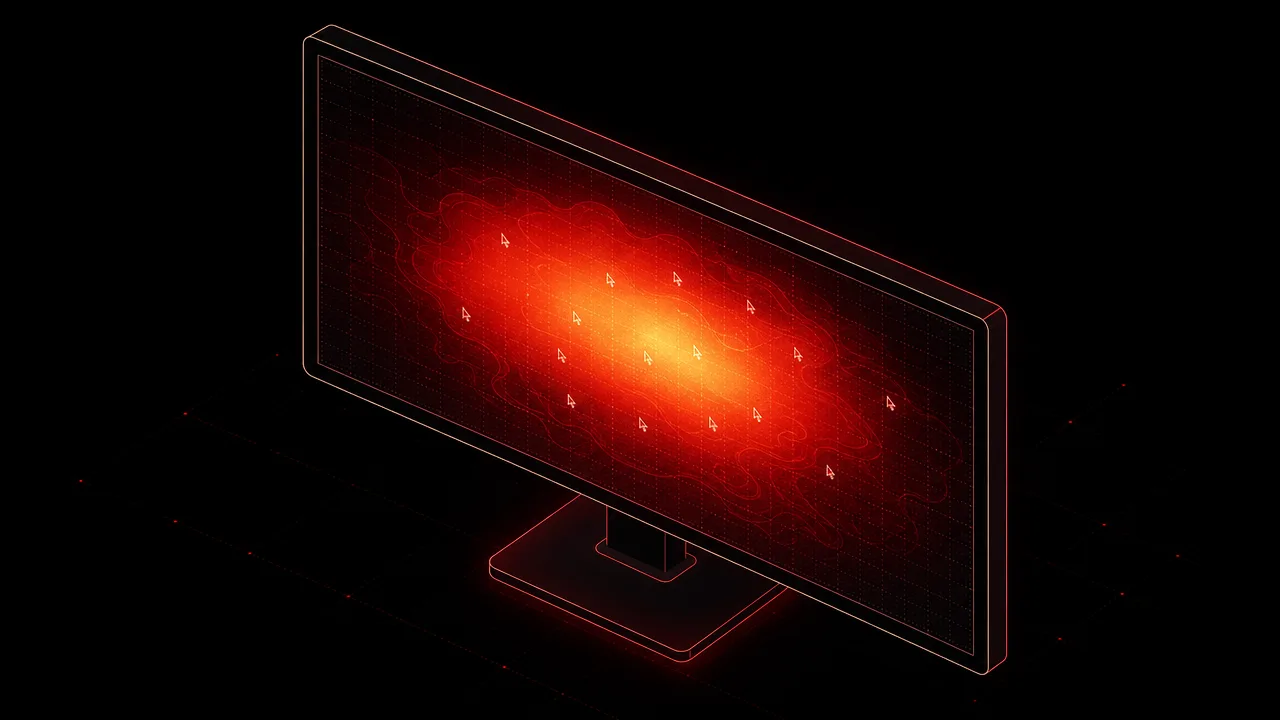
A mouse heatmap is one of the most visually intuitive ways to summarise computer usage. Instead of reporting a number, it draws a picture: warm colours where the cursor and clicks pile up, cool colours where they do not. The technique is borrowed from thermal imaging, and the metaphor is deliberate. Density of activity becomes density of colour, and the resulting image makes patterns visible that no table of coordinates ever would.
This page covers what a mouse heatmap is, how it is generated, the difference between cursor and click variants, common patterns that show up in published research, and where the visualisation is useful as opposed to merely decorative.
What is a mouse heatmap?
A mouse heatmap is a spatial visualisation that aggregates pointer activity over time. The screen, page, or application window is treated as a coordinate grid, and each recorded event contributes to the density at its coordinates. The accumulated density is then rendered as a colour overlay, with warmer hues representing higher density and cooler hues representing lower density. The result is a single image that summarises potentially millions of individual data points.
Two broad families of mouse heatmap exist. The first family, click heatmaps, aggregates discrete click events. Each click adds a small contribution at its coordinate, and the resulting image highlights buttons, links, and regions that attract interaction. The second family, cursor or movement heatmaps, aggregates cursor positions sampled continuously while the pointer is on screen. The resulting image highlights regions where the cursor lingers, regardless of whether anything was clicked there.
The two families answer different questions. Click heatmaps describe behaviour at the moment of decision. Cursor heatmaps describe behaviour during exploration and scanning. Both are routinely called mouse heatmaps, and the distinction is worth keeping in mind when reading the visualisation.
Why does a mouse heatmap matter?
The value of a heatmap is that it converts spatial data into a form humans can read at a glance. A list of cursor coordinates is incomprehensible. A list of clicks per element is more useful but still requires interpretation. A heatmap shows where the activity actually went, in the same layout the user saw, and the eye picks out hot zones and dead zones almost instantly.
For UX research, the practical payoff is identifying problems that surveys and analytics do not surface. A hot zone over a non-clickable element suggests an affordance error. A cold zone over a primary call to action suggests a hierarchy problem. A diffuse cloud with no obvious centre suggests that the page is not directing attention at all. These conclusions are easier to draw from an image than from a spreadsheet.
For personal usage analytics, a mouse heatmap answers a different set of questions. Which corners of the screen do I actually use? Where do my windows tend to sit? Are my most-used controls under the cursor or across the screen from it? The same visualisation technique produces a different insight when the aggregation window changes from one page across many users to one user across many sessions.
How is a mouse heatmap generated?
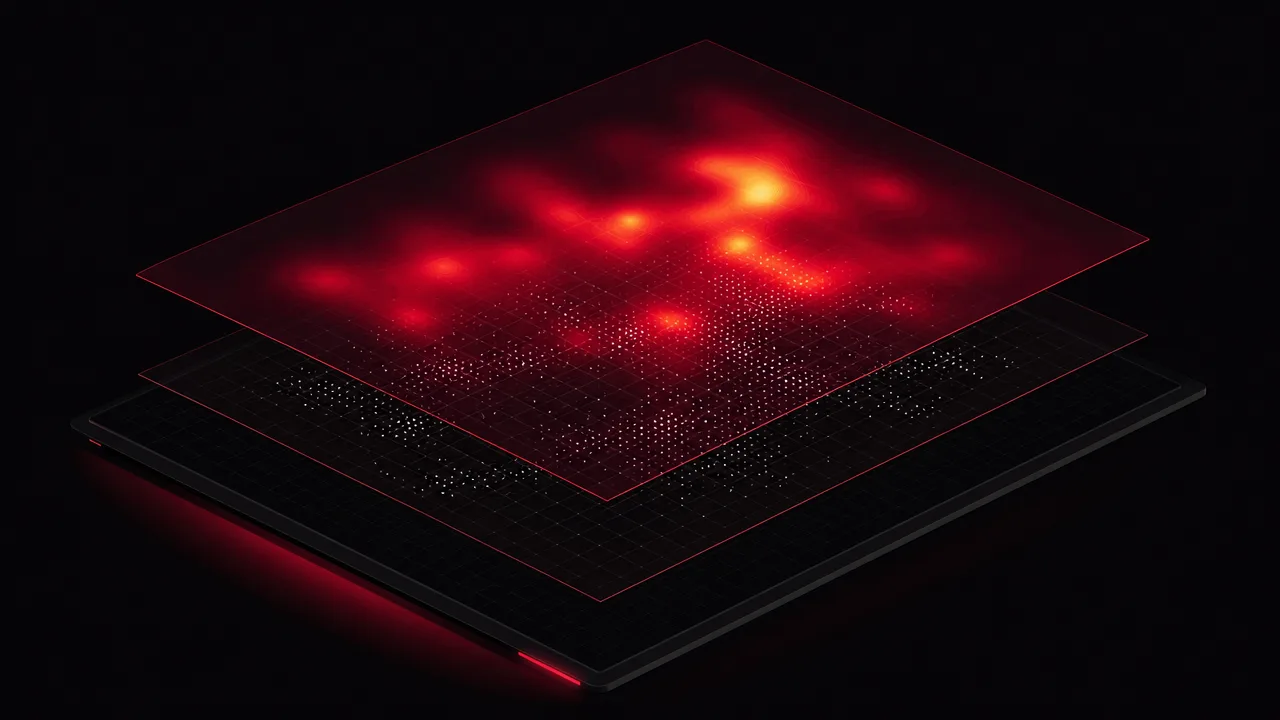
Every implementation follows the same broad pipeline. First, raw events are captured. For click heatmaps the events are discrete: a coordinate, a timestamp, sometimes a button identifier and the element under the cursor. For cursor heatmaps the events are samples: coordinates of the pointer recorded at regular intervals or whenever a movement event fires. Sampling rates vary by tool but are usually high enough to reconstruct smooth paths.
Second, coordinates are normalised. Different visitors view different screens at different resolutions, and a click at pixel coordinate (640, 400) on one display is not the same place as the same coordinate on another. UX research tools normalise to the document layout, so a click on the primary button is recorded as a click on the primary button regardless of viewport size. Personal usage trackers tend to normalise per monitor instead, since the question is about the user's own physical screen real estate rather than a shared layout.
Third, the normalised events are accumulated into a density grid. Each event contributes a small Gaussian blob around its coordinate, and the blobs are summed across all events. The result is a smooth two-dimensional density field that can be coloured according to a chosen palette and overlaid on a screenshot or wireframe. The smoothing radius and the colour mapping are the main parameters that affect how the heatmap looks, and tools differ in their defaults.
Multi-monitor setups introduce a wrinkle. Personal trackers typically produce one heatmap per monitor, since monitors usually have different resolutions, different aspect ratios, and different roles. A 4K main display and a portrait secondary do not share a meaningful coordinate space, so combining them into one image would hide more than it reveals. UX research tools sidestep the issue by working on a single browser window at a time.
Common benchmarks
Reliable numerical benchmarks for mouse heatmaps are rare. The visualisation is qualitative by design, and most published reference points describe patterns rather than thresholds. A few remain useful as anchors.
- Fitts's Law, formulated by Paul Fitts in 1954, predicts that the time to acquire a target with a pointer scales with the logarithm of distance over target width. In practice this means cursor activity clusters near recently used controls and near large targets, because those are cheaper to reach. Edges and corners are effectively infinite targets in this model, which is why heatmaps often show high density at screen edges in operating systems that put controls there.
- Nielsen Norman Group's eye-tracking studies have documented the F-pattern of scanning on text-heavy pages: a longer horizontal pass across the top, a shorter pass below it, and a vertical scan down the left edge. Movement heatmaps frequently show a similar shape on text-dense pages, although NN/G has noted that the F-pattern emerges most strongly when page structure is weak.
- The Z-pattern is the analogous shape for pages with less text and more visual structure: top-left to top-right, a diagonal sweep down to the bottom-left, and a final horizontal pass along the bottom. Landing pages and signup flows often produce heatmaps consistent with this pattern.
- Industry write-ups commonly cite that cursor position correlates with eye gaze roughly seventy to eighty percent of the time, which is why movement heatmaps are treated as an attention proxy. The correlation is not perfect, and individual users vary substantially in how closely their cursor tracks their gaze.
These reference points describe tendencies in aggregate data. Any single heatmap can deviate from them, and the deviation is often where the interesting finding lies.
Examples
Three short scenarios illustrate how mouse heatmaps are read in practice.
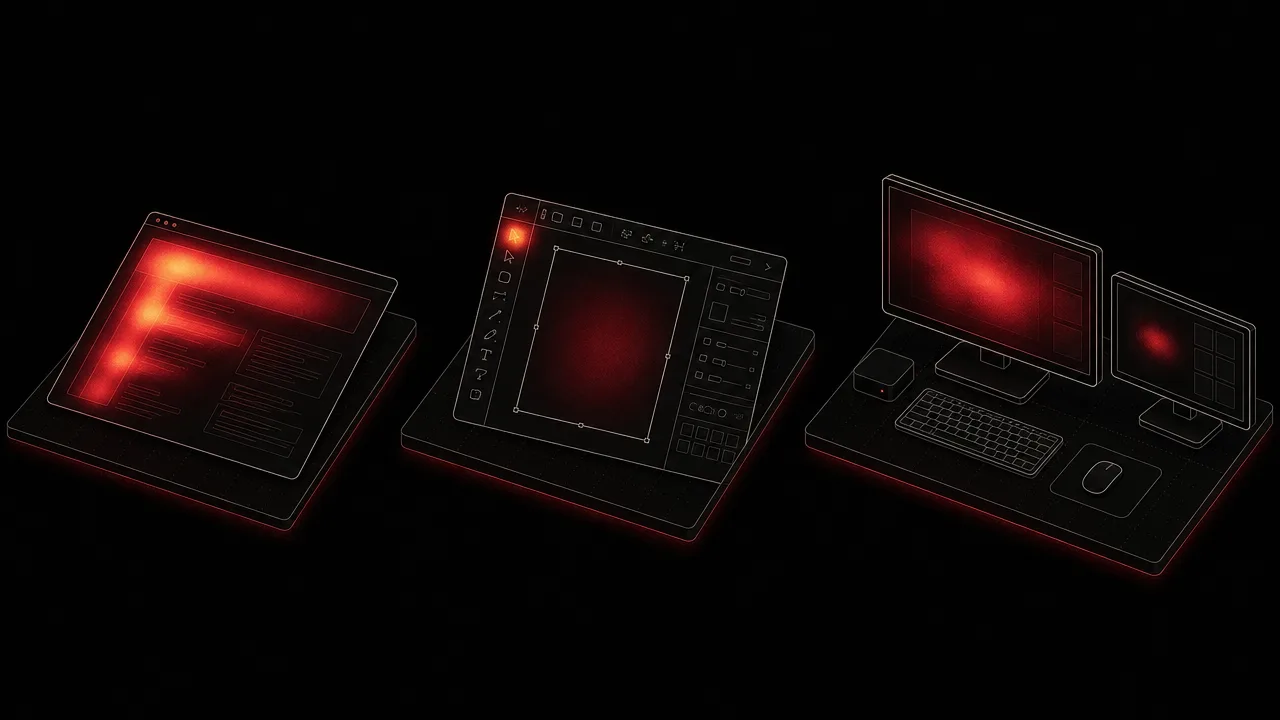
A UX researcher analyses a landing page after a redesign. The click heatmap shows a dense cluster on the primary call to action, which is the intended outcome. It also shows a secondary cluster on a product image that is not linked, suggesting that visitors expect it to be interactive. The movement heatmap shows a clear F-shape across the headline and the first paragraph, then a fade into the lower body, suggesting that few visitors scan past the fold. The researcher proposes making the image clickable and shortening the body copy.
A product designer working in Figma examines a movement heatmap of their own workspace over a week. Activity clusters tightly around the layers panel, the canvas centre, and the right-side properties panel. A long diagonal trail connects the layers panel to the properties panel, suggesting that the designer crosses the canvas frequently. They reconfigure their workspace to put the most-used inspector closer to the layers panel, on the theory that, per Fitts's Law, shorter pointer paths should make the workflow faster.
A WhatPulse user looks at a personal heatmap of their primary monitor over the past month. The hottest zone sits at the top-left quadrant, where their browser usually lives. A secondary zone covers a strip across the taskbar at the bottom. The right side of the screen is almost entirely cool, even though a second monitor sits to its right. The user realises that they almost never drag windows across the boundary, and that the right edge of the primary display is effectively wasted real estate.
Misconceptions
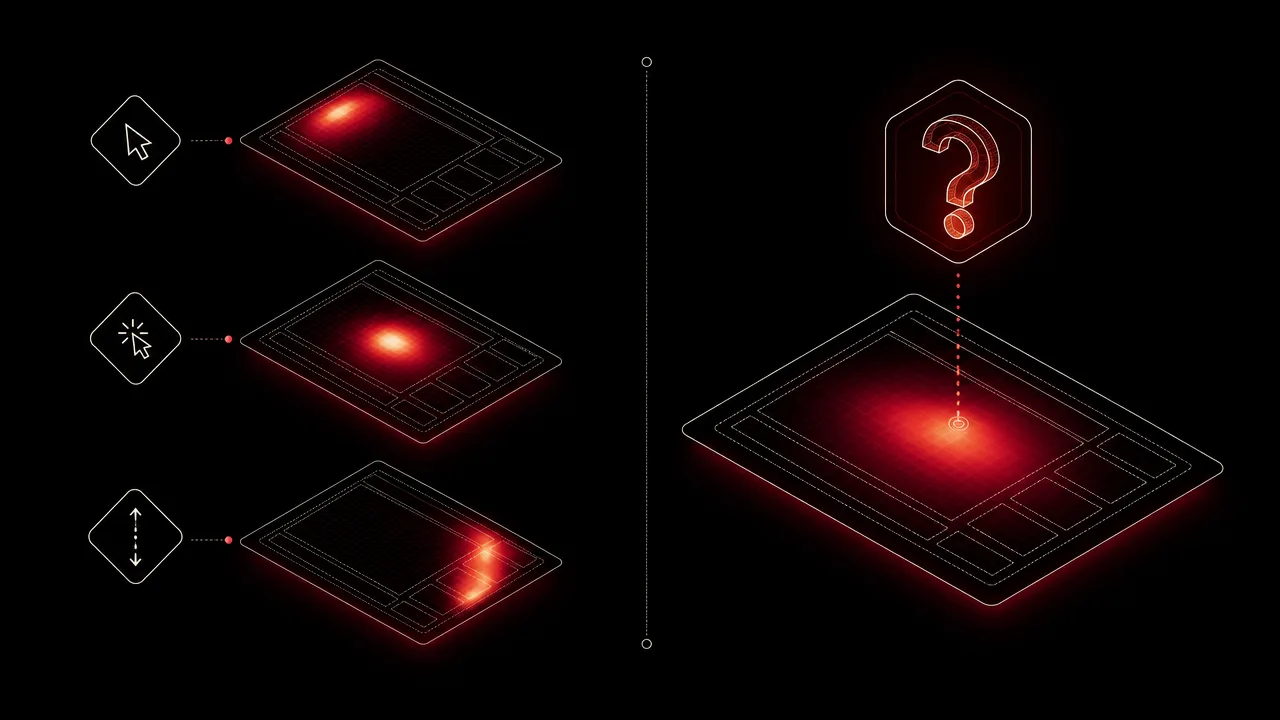
The most common confusion is between click maps, cursor maps, and scroll maps. All three are colloquially called heatmaps, and tools like Hotjar and Crazy Egg offer several of them under one umbrella, but they measure different things. Click maps record discrete interactions, cursor maps record continuous positions, and scroll maps record how far down a page visitors travel. Reading a scroll map as if it were a click map tends to produce wrong conclusions about which elements get used.
A second misconception is that a mouse heatmap measures attention directly. It does not. Cursor position is a proxy for gaze, and a useful one, but the correlation is partial. Many users park their cursor in a single spot while reading elsewhere on the screen, and some users move the cursor only when about to click. A heatmap that shows a single bright spot in one corner may simply mean the cursor sat there, not that the user stared at it.
A third misconception is that a heatmap with strong patterns proves a particular interpretation. F-pattern and Z-pattern shapes are tendencies derived from aggregate eye-tracking studies, not signatures that confirm a specific scanning behaviour. The same shape can emerge from a weak page structure, a strong page structure, or a small sample size with a few unusually active visitors. Heatmaps are best read alongside session recordings and conversion data rather than on their own.
Related concepts
A mouse heatmap is part of a wider vocabulary of input and attention metrics. The following terms appear regularly alongside it.
- Mouse clicks: the raw click events that feed click-style heatmaps.
- Keyboard heatmap: the keyboard equivalent, visualising key-press density rather than cursor position.
- Input activity: the combined stream of keyboard and mouse events from which heatmaps are derived.
- Input intensity: the rate of input events over time, often shown next to a heatmap as a temporal complement.
- Usage distribution: how activity is split across applications, projects, or screen regions.
- Activity tracking: the broader practice of recording usage signals, of which heatmaps are one output.
- Foreground application: the application that owns the window under the cursor when events are recorded.
- Activity trends: how heatmap shapes evolve over weeks and months as habits change.
- Usage analytics: the dashboards and reports in which heatmaps are typically presented.
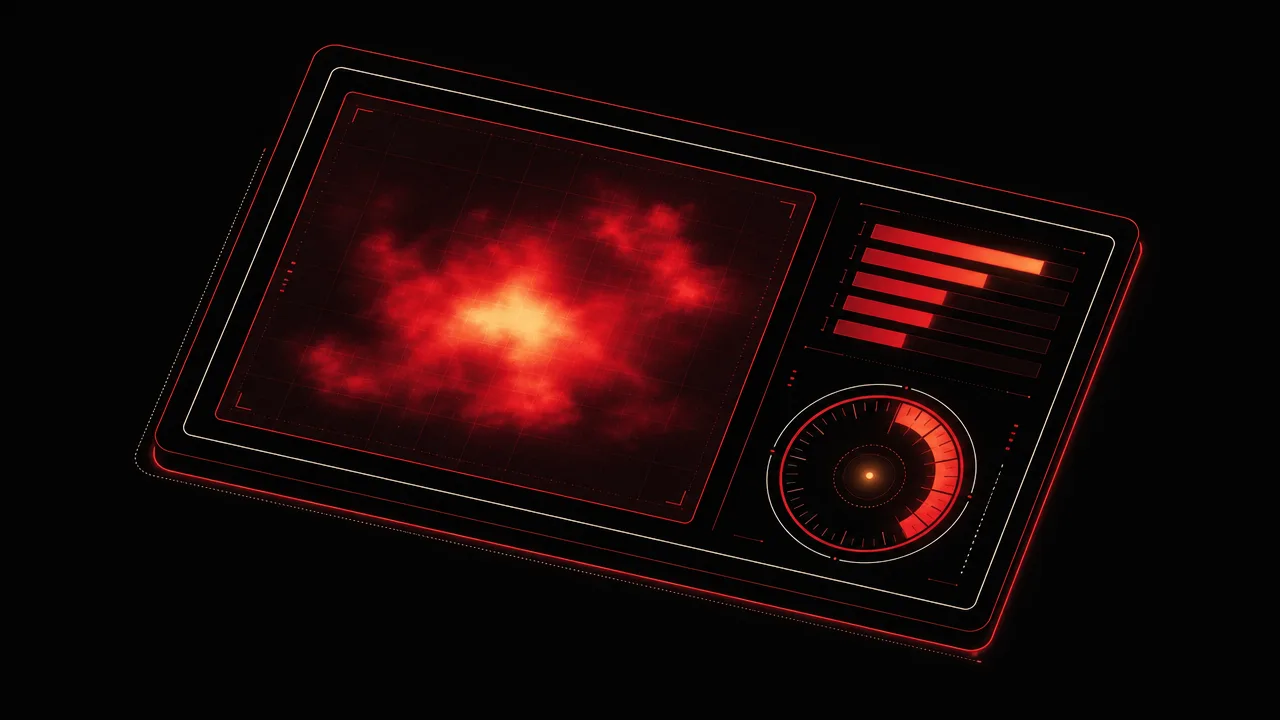
Tracking with a mouse heatmap
Mouse heatmaps in personal usage tracking work differently from the ones in UX research tools. A UX heatmap aggregates many visitors on a single page to inform a design decision. A personal heatmap aggregates one user across many sessions on their own desktop, to reveal how that user actually inhabits their screen. WhatPulse is one of the tools that takes this second approach: it records cursor activity locally on Windows, macOS, and Linux, attributes it to the foreground application, and produces a per-monitor heatmap that the user can inspect over any time range.
Because the recording happens on the device, no remote server sees the cursor coordinates by default. Users who choose to sync a personal dashboard can compare heatmaps across weeks and months, watch a hot zone shift as their workflow changes, and notice when a new monitor or a new application alters the underlying pattern. The shape of the heatmap tends to be more stable than people expect, which is part of what makes it educational. Habits leave a visible signature.
The aim is not to optimise the heatmap toward any particular shape. There is no correct distribution of cursor density on a personal desktop. The aim is to see the shape that already exists, which is harder to do without the visualisation than it sounds.
Frequently asked questions
Is a mouse heatmap the same as an eye-tracking heatmap?
No. Cursor position correlates with eye gaze only roughly seventy to eighty percent of the time in published research, so a mouse heatmap is a useful proxy for attention but not a substitute for true eye tracking.
What is the difference between a click map and a movement map?
A click map plots discrete click events and answers questions about interaction. A movement or cursor map samples cursor position over time and answers questions about hovering, hesitation, and scanning behaviour.
How often is the cursor position sampled?
Sampling rates vary by tool. Common implementations record cursor coordinates several times per second or whenever a movement event fires, then aggregate the samples into a density grid for rendering.
Does a mouse heatmap work across multiple monitors?
Personal-usage trackers typically build a heatmap per monitor, since coordinate spaces and resolutions differ. UX research tools usually render one heatmap per page or screen rather than per physical display.
Can a mouse heatmap reveal what someone is reading?
Indirectly at best. Cursor pauses and movement patterns can suggest where attention lingers, but many users park the cursor in one spot while reading elsewhere, so the signal is approximate.
Are mouse heatmaps useful on touchscreens?
Touchscreens do not produce continuous cursor movement, so movement maps do not apply. Tap maps, which are the touch equivalent of click maps, remain useful and are widely supported.
How is a personal mouse heatmap different from a UX research heatmap?
A UX research heatmap aggregates many visitors on a single page to inform design decisions. A personal heatmap aggregates one user across many sessions on their own desktop, to reveal habits and screen-region preferences.
Conclusion
A mouse heatmap is a compact way of seeing where pointer activity actually goes. It exists in two main flavours, click and cursor, that answer different questions, and it lives inside a wider family that includes scroll maps and keyboard heatmaps. Read carefully, it surfaces patterns that no table of coordinates would reveal at a glance.
Treated as a proxy rather than a verdict, compared against the user's own history rather than against an ideal shape, and paired with click data and session-level context, the mouse heatmap is one of the more honest visualisations a usage tracker can produce.