Keyboard heatmap
A visual map of which keys are used most over time.
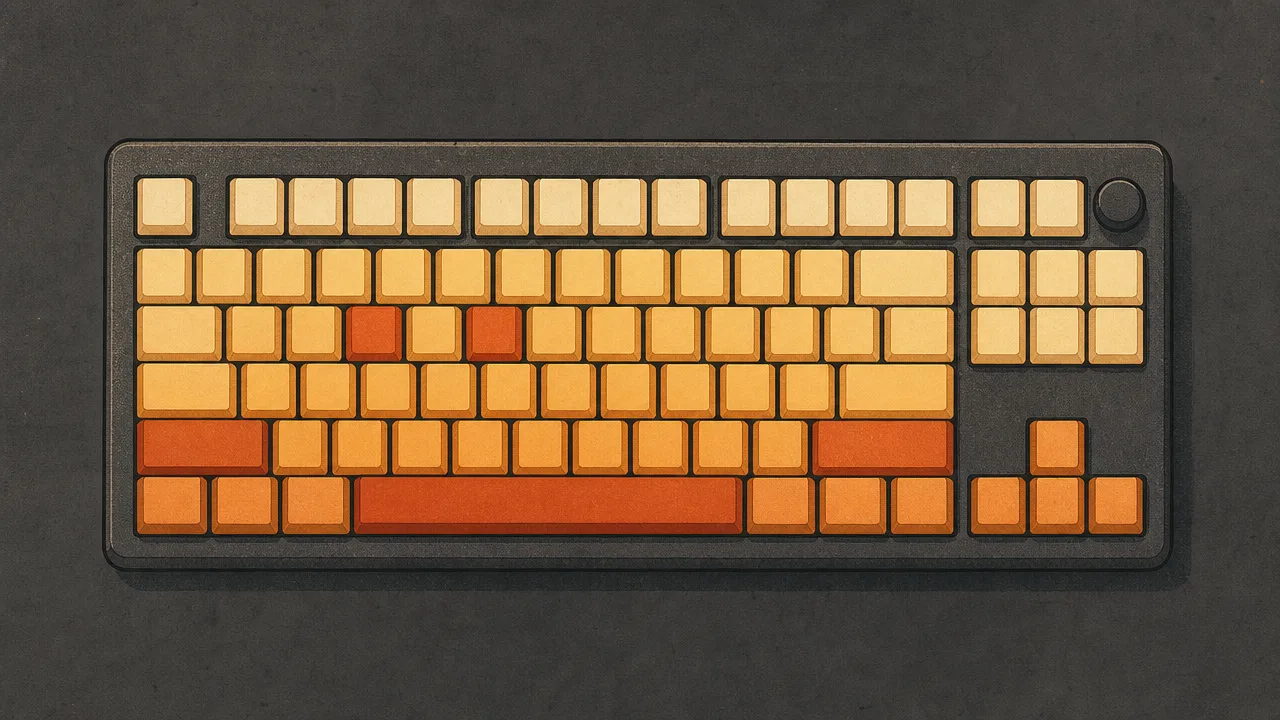
A keyboard heatmap is one of the more immediately legible pictures any computer-activity tracker produces. It takes the raw count of how many times each key has been pressed and paints those numbers onto a picture of the keyboard, colouring the busiest keys in warm, intense tones and the quiet keys in pale ones. The result is a visual fingerprint of how someone uses their keyboard, and it differs dramatically between a novelist, a developer, and a gamer.
This page covers what a keyboard heatmap is, how it is generated, what patterns to expect for different kinds of work, and how it relates to other input-activity metrics like keystrokes, input-intensity, and the mouse-heatmap.
What is a keyboard heatmap?
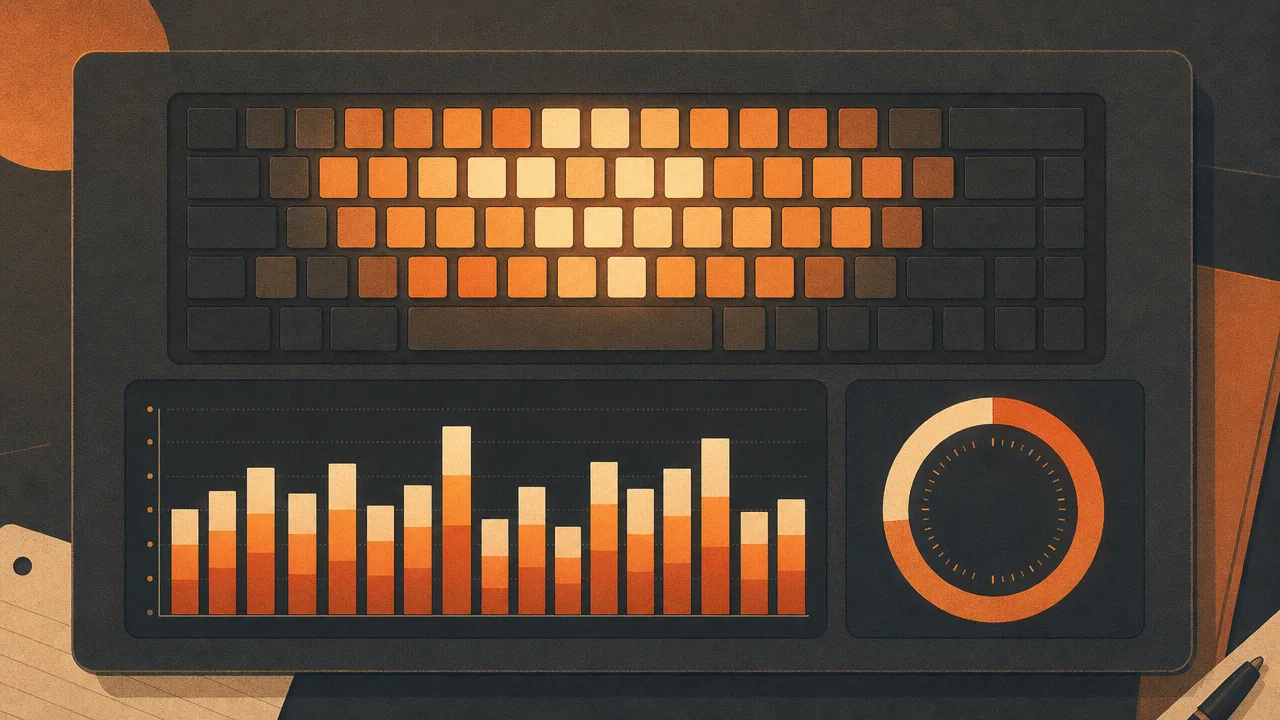
A keyboard heatmap is a visualisation that lays out a keyboard image and shades each key according to how often it has been pressed during a chosen time window. Heavily used keys are drawn in warm, saturated colours, lightly used keys in cool or pale tones, and untouched keys in a neutral background colour. The picture answers a single question quickly: which keys carry the most of the work.
The underlying data is a simple table of key codes mapped to press counts. The heatmap is the rendering of that table onto a layout. Two heatmaps generated from the same counts can look very different depending on the colour scale, whether the scale is linear or logarithmic, and which layout the tool assumes the user is on. The data is the same; the picture is an interpretation.
Importantly, a keyboard heatmap is not a recording of what was typed. It captures only the frequency of each physical key press, with no reconstruction of words, sentences, or commands. The same heatmap could be produced by very different documents that happen to share similar letter-frequency profiles.
Why does a keyboard heatmap matter?
Raw keystroke totals are easy to misread. A figure like "47,000 keys today" is impressive on its own and yet says almost nothing about how those presses were distributed. A heatmap forces the structure of that activity into view. It shows whether the day was spent in prose, in code, in shortcuts, or in gaming, and it does so without requiring the viewer to study a spreadsheet.
For people considering an ergonomic change, a heatmap is one of the most useful starting points. It shows directly how much work the pinkies, the thumbs, and the bottom row are doing. Heavy reliance on keys far from the home row is a signal that finger travel, and therefore strain, is higher than it needs to be. That observation is what motivates many users to try alternative layouts like Dvorak or Colemak, or to remap modifiers to friendlier positions.
For people who simply enjoy understanding their own habits, the heatmap is a snapshot of a long stretch of behaviour reduced to one image. It is also one of the few activity visualisations that is pleasant to share, because it carries no private content. The picture shows pattern without revealing text.
How is a keyboard heatmap generated?
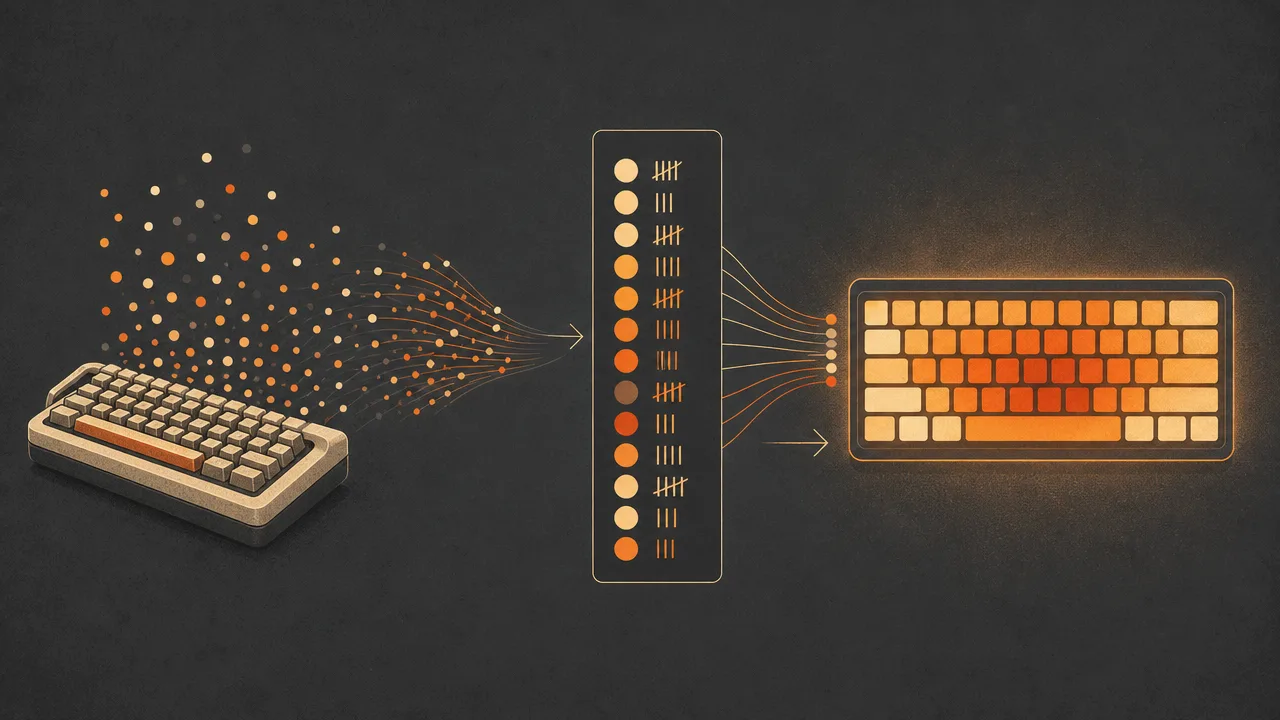
The pipeline behind a keyboard heatmap is short. The tracking software listens for low-level key events from the operating system. Each event increments a counter for the key in question, often stored against a key code rather than a character so that the underlying layout can be reinterpreted later. That counter table is the entire raw dataset.
Turning the counts into a picture requires three more decisions. First, the layout the heatmap should render: QWERTY, Dvorak, Colemak, AZERTY, and so on. Modern tools detect the active layout from the operating system and bind counts to the correct physical positions. Older or simpler tools assume QWERTY and can mislabel keys for users on other layouts.
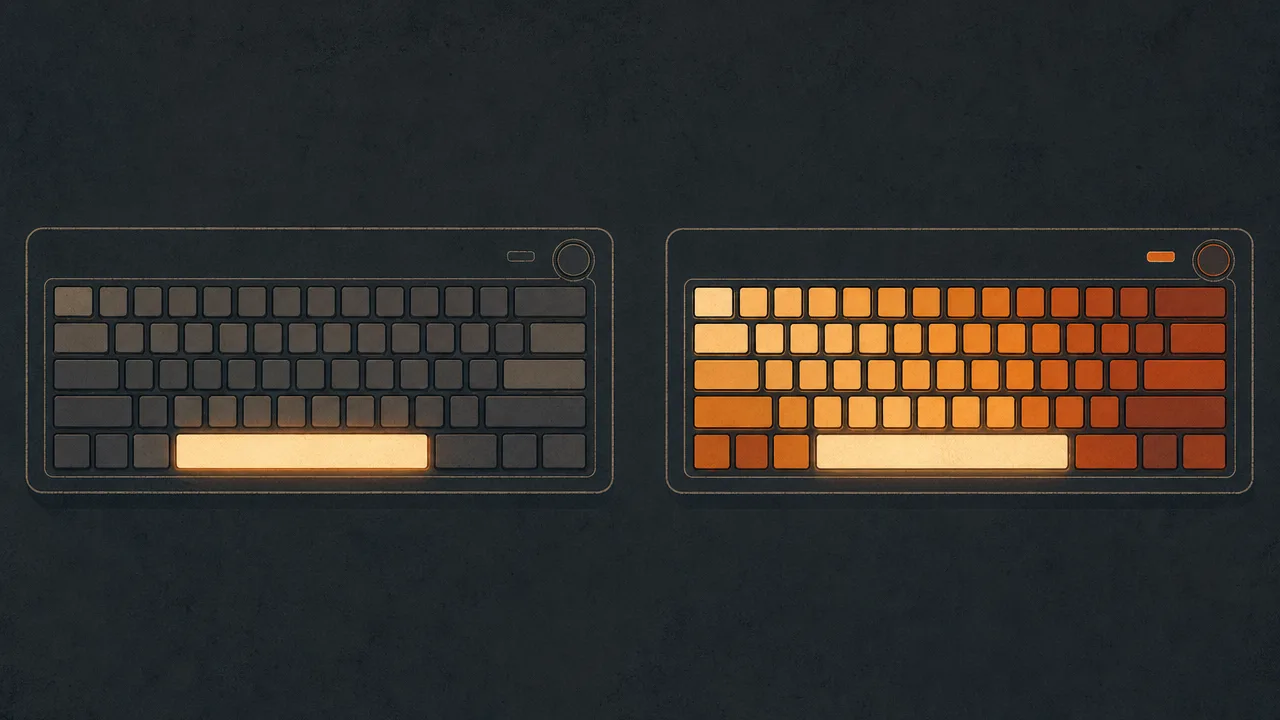
Second, the colour scale. A linear scale maps the highest count to the most saturated colour and everything else proportionally. That is intuitive, but on a normal English heatmap the space and shift keys are so dominant that everything else looks muted by comparison. A logarithmic scale, or a scale that clips the top value, brings out structure in the middle of the distribution at the cost of some accuracy at the extremes. Both are reasonable; they answer slightly different questions.
Third, the time window. A heatmap of one hour reveals the current task. A heatmap of a day reflects that day's mix of applications. A heatmap of a month or a year averages across all of them and tends toward the user's general profile. Tools that let the user pick the window, and that can also produce per-application heatmaps, give a much richer picture than a single fixed view.
Common benchmarks
The shape of a keyboard heatmap depends on what was typed, but a few reference points apply to almost any general-purpose English heatmap. They come from large-scale letter-frequency studies rather than from heatmap tools themselves, and they describe the prose part of the workload.
- For ordinary English text, the most frequent letters are E, T, A, O, I, N, S, R, H, L, D, C, U, according to Peter Norvig's "Mayzner Revisited" analysis of roughly 3.5 trillion letters drawn from the Google Books corpus. The old typesetter's mnemonic ETAOIN SHRDLU is close, with L, R, and C slightly higher than that ordering suggested.
- On any general-purpose heatmap, space is by some margin the most pressed key, because it occurs between every pair of words in English prose. It does not appear in letter-frequency tables, which is why heatmaps tend to surprise people the first time they look at one.
- Shift is the second key that tends to dominate. It is pressed for every capital letter, most sentence-ending punctuation on US layouts (the question mark and the colon, among others), and many keyboard shortcuts. On programmer heatmaps, shift often outranks every letter.
- Z, Q, J, and X consistently sit at the bottom of any English-language heatmap. In Norvig's data, Z is the least frequent letter, with Q close behind.
- Coder heatmaps usually elevate the bracket keys, semicolon, equals, and the modifier cluster (control, alt, command) far above their prose-text baseline. The exact pattern depends on language: the curly brace is heavy in C-family code, the parenthesis in Lisp, the angle bracket in HTML and templating languages.
- Gamer heatmaps concentrate on a small cluster of WASD, the spacebar, and a few number keys, with the rest of the keyboard nearly cold. This is one of the most visually distinctive heatmap shapes, and it is the inverse of a prose heatmap, where activity is spread across most letters.
These are population-level expectations. Individual heatmaps vary substantially with the language being written, the programming languages and editors in use, and the genre of games being played.
Examples
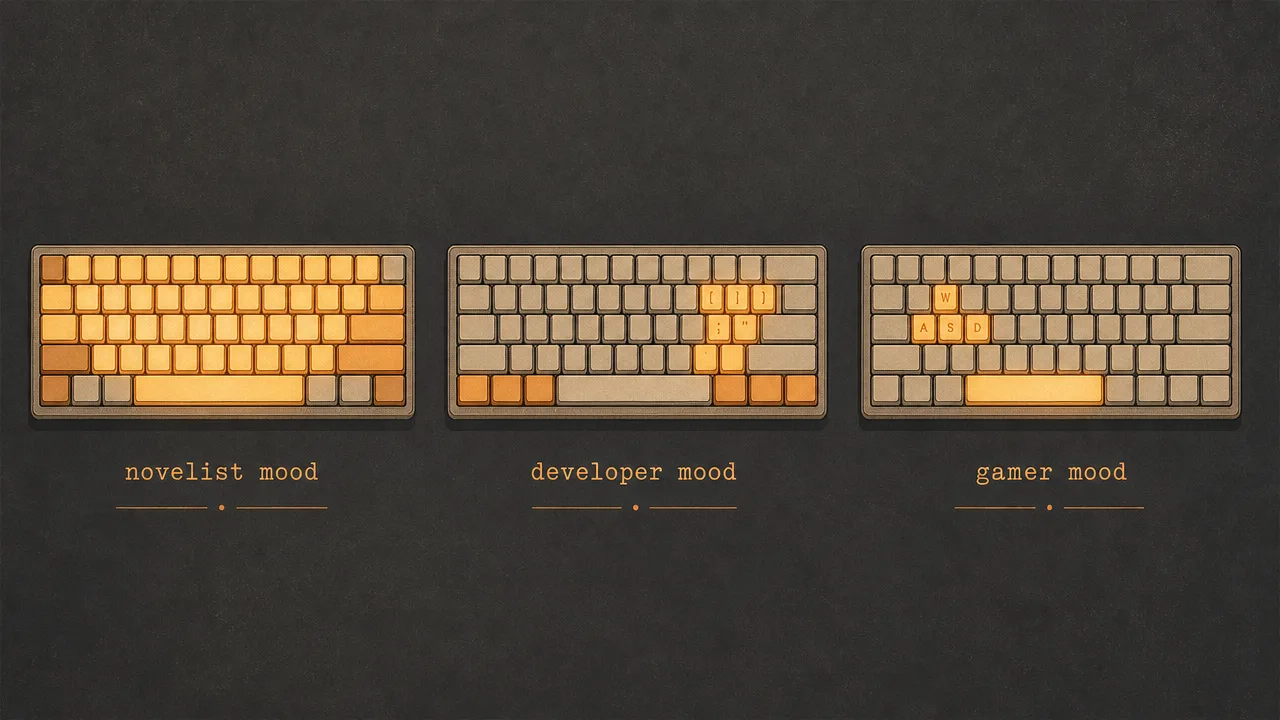
A few stylised examples make the shape of a heatmap easier to picture.
A novelist spends a week drafting a long-form manuscript. Their heatmap is dominated by space and shift, then by the vowels E, A, O, I, and the consonants T, N, S, R, H. The arrow keys glow gently from navigating around the document. The bracket cluster is almost invisible. The picture looks like a textbook letter-frequency chart, because that is essentially what it is.
A JavaScript developer spends the same week on a typical web application. Their heatmap still shows heavy space and shift use, but the curly brace, parenthesis, square bracket, equals, and semicolon all glow strongly. Tab and the modifier cluster light up from autocomplete and shortcuts. The individual letters look broadly similar to the novelist's, but with more weight on consonants used in variable names like S, T, N, and L, and less on the rarer English letters.
A first-person shooter player spends most of their gaming evenings in matches. Their heatmap shows W, A, S, D, the spacebar, shift, and control glowing hot, along with R for reload and a few number keys for weapon selection. The rest of the keyboard is essentially cold. The same person, looking at a separate heatmap for their text editor, sees an entirely different distribution. Per-application heatmaps are what make those two patterns visible side by side instead of averaged together.
Misconceptions
The most common misconception is that a keyboard heatmap is a kind of keylogger. It is not. A heatmap stores only counts per key, with no record of order, no record of timing beyond aggregation, and no reconstruction of the text. Two completely different documents can produce nearly identical heatmaps if their letter frequencies happen to match.
A second misconception is that the brightest keys on the heatmap are the keys you should worry about ergonomically. Space and shift are usually the brightest, but they are pressed by the thumb and the pinky in positions that are reasonably well supported. The keys that often matter more for ergonomics are the moderately used ones on the top and bottom rows, especially when they involve repeated long reaches. The heatmap shows raw usage; the ergonomic interpretation requires layering finger assignments on top.
A third misconception is that a heatmap reflects skill or speed. It does not. A fast typist and a slow typist who write the same document will produce essentially the same heatmap, because each individual key is pressed roughly the same number of times. Speed lives in the timing data, not in the press counts.
A fourth, more subtle misconception is that the heatmap is comparable across keyboards without adjustment. A user who switches from QWERTY to Colemak will see their heatmap shift radically over time, because the same letters now live on different physical keys. The underlying writing has not changed; the layout binding has. Tools that track the layout per session avoid this trap.
Related concepts
A keyboard heatmap is the visual summary of several lower-level signals, and it sits alongside a cluster of metrics that describe input and attention more broadly.
- Keystrokes: the raw count of key presses that the heatmap visualises.
- Input activity: the combined stream of keyboard and mouse events over time.
- Mouse heatmap: the equivalent visualisation for mouse clicks, often paired with the keyboard view.
- Input intensity: how rapidly input events arrive within active periods, independent of which key.
- Application usage: the foreground application against which each keystroke is recorded, enabling per-app heatmaps.
- Mouse clicks: the parallel signal for the pointer side of the input picture.
- Active time: the duration during which the keystrokes feeding the heatmap were registered.
- Foreground application: the focused window when a key was pressed, which determines per-application attribution.
- Activity trends: how the shape of the heatmap shifts week over week as work changes.
- Usage distribution: the broader breakdown of where time and input go across applications and categories.
Tracking with a keyboard heatmap
Any tracker that records per-key counts can render a keyboard heatmap. WhatPulse is one such application. It runs locally on Windows, macOS, and Linux, counts key presses against the focused window, and displays the result as a coloured heatmap inside the desktop application. The heatmap can be viewed over today, the past week, month, or longer windows, and the underlying counts are stored on the device by default.
The heatmap detects the active keyboard layout and binds counts to the right physical positions, so users on Dvorak, Colemak, AZERTY, or other layouts see an accurate picture without manual configuration. Premium accounts can also generate per-application heatmaps, which is where the picture gets genuinely informative: the same user's writing application, code editor, and game can each produce a recognisably different heatmap shape, and seeing them side by side often surfaces patterns that a single combined view hides.
The point of looking at a heatmap is not to score the day. It is to understand the structure of your typing in a way that a single keystrokes-per-day number cannot show, and to spot the heavy keys, the lopsided modifier use, and the application-specific patterns that might suggest small ergonomic adjustments over time.
Frequently asked questions
Is a keyboard heatmap the same as a keystroke counter?
No. A keystroke counter reports a single number per key. A keyboard heatmap takes those counts and renders them as a coloured layout, so the relative balance between keys is visible without reading a table.
Why are space and shift almost always the brightest keys?
Space separates almost every word in English, and shift is pressed for every capital letter, most punctuation on US layouts, and many keyboard shortcuts. Together they typically dominate any general-purpose heatmap.
Does a keyboard heatmap capture what I actually typed?
No. A heatmap counts how often each physical key was pressed, not the words formed by those presses. The text itself is not stored or reconstructed from the heatmap.
Can a heatmap tell me if I should switch to Dvorak or Colemak?
It can suggest it. If your heatmap shows heavy use of keys on the top and bottom rows, an alternative layout that places frequent letters on the home row would reduce finger travel. The decision still depends on retraining cost and your specific workload.
Does the heatmap change if I switch keyboard layouts?
A well-designed heatmap detects the active layout and maps counts to the correct physical keys. Older tools sometimes assume a fixed QWERTY arrangement, which can produce misleading visuals on Dvorak, Colemak, or AZERTY layouts.
Why does the heatmap differ between applications?
Each application has its own input vocabulary. A code editor leans heavily on brackets, semicolons, and modifier keys. A game leans on WASD and the spacebar. A word processor leans on letters and punctuation. Per-application heatmaps make those differences visible.
How long do I need to track before a heatmap is meaningful?
A few hours of typing already produces a recognisable pattern. Stable, comparable heatmaps usually require at least a week of normal use, and longer windows are better when comparing applications or layouts.
Conclusion
A keyboard heatmap turns a long table of per-key counts into a single picture that anyone can read in a few seconds. It does not capture text, it does not measure skill, and it does not by itself prove anything about ergonomics. What it does, well, is make the structure of typing visible. The domination of space and shift, the warmth across the vowels and the common consonants, the cold corners around Z and Q, and the dramatic differences between writing, coding, and gaming all become legible at a glance.
Used alongside keystrokes, input-intensity, application-usage, and the mouse-heatmap, the keyboard heatmap is one of the more honest and least intrusive ways to understand how a person actually uses their keyboard over months and years.