Input intensity
Density of input events per unit of active time.

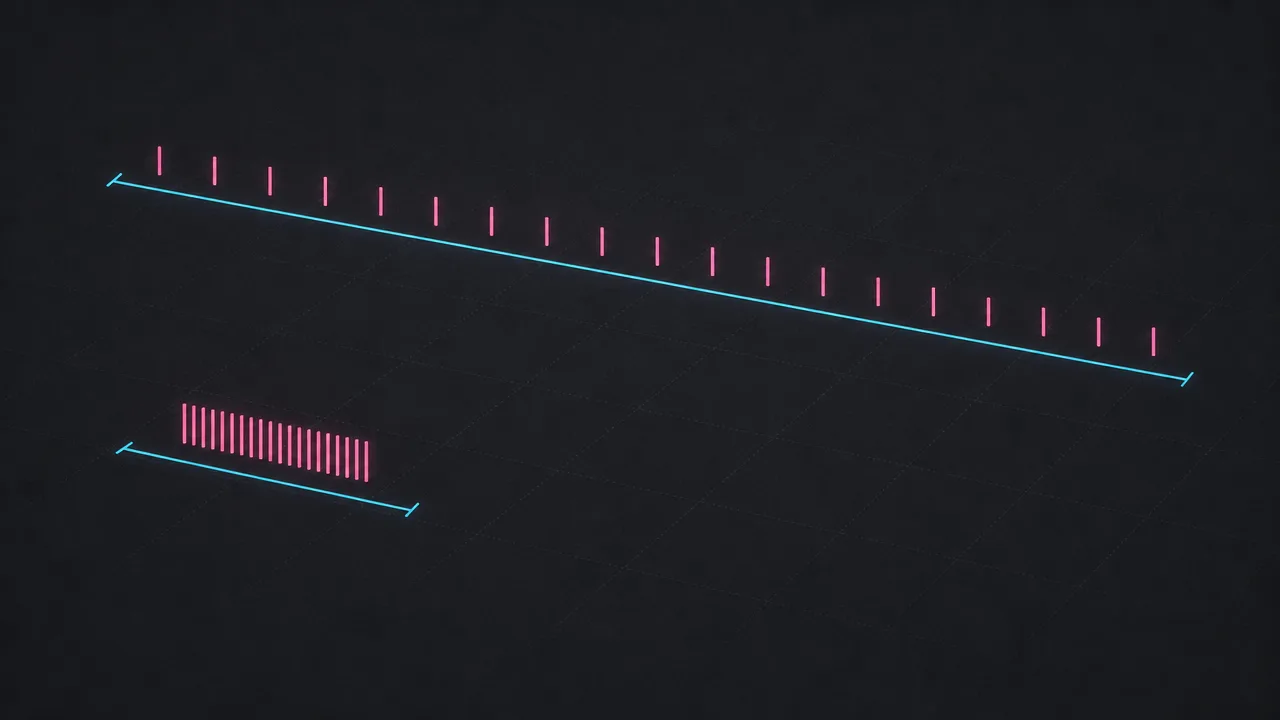
Input intensity describes how densely input events arrive during the time someone is actually using their computer. It is a rate, not a total. Two people who each pressed twenty thousand keys in a day can have very different intensities if one of them spent eight hours at the keyboard and the other spent four. The same logic applies to mouse clicks, scroll events, and any other low-level input the operating system can observe.
This page covers what input intensity is, how it is measured, what the most commonly cited benchmarks look like for office work and gaming, and how it relates to the other input metrics most analytics tools report.
What is input intensity?
Input intensity is the number of input events recorded per unit of active time, usually expressed as events per minute or events per hour. The events themselves are the same low-level signals that drive active-time and input-activity metrics: keystrokes, mouse clicks, scroll ticks, and mouse-movement samples. What makes intensity different is the denominator. Where a raw count answers how many, intensity answers how densely.
In practice, intensity is reported in three common forms. Keystrokes per minute, sometimes converted to words per minute by dividing by five, describes typing density. Clicks per minute describes pointing-device density. A blended events-per-minute figure combines the two, sometimes with weighting to keep mouse-move samples from drowning out everything else. Whichever form is used, the meaning is the same: how busy were the input devices while the user was present.
Input intensity sits one level above raw counts and one level below interpretations like productivity scores or engagement grades. It is a derived metric, but a simple one, and it is usually closer to the underlying signal than the labels built on top of it.
Why does input intensity matter?
Input intensity is most useful for three things: spotting ergonomic risk, characterising the shape of a working session, and telling apart applications that produce very different physical demand on the user.
On the ergonomics side, sustained high intensity without breaks is one of the recognised contributors to computer-related musculoskeletal discomfort. The picture is nuanced. Research summarised by Wellnomics argues that posture, static loading, and lack of micro-breaks matter more than raw repetition for most office workers, and notes that the average computer user produces fewer than four thousand keystrokes a day, well below counts that historically were treated as automatically dangerous. Even so, very high sustained intensity, especially in data-entry or transcription roles, remains worth watching when paired with long uninterrupted sessions.
As an engagement signal, intensity captures something that pure active time misses. A four-hour active session at low intensity looks similar on a time chart to a four-hour session at high intensity, but the underlying experience is very different. Intensity helps explain why two days with the same active time can feel completely different by the end of them.
For application analysis, intensity is one of the clearest fingerprints an app produces. Spreadsheets, code editors, instant-messaging apps, and design tools each have characteristic intensity profiles. Watching how intensity shifts as the foreground application changes can be more informative than watching the time totals alone.
How is input intensity measured?
The mechanics are similar to active-time measurement. The tracking software listens for low-level input events from the operating system and records them with timestamps. The intensity calculation then divides the number of events by the duration of the window being analysed, restricted to the portion of that window that counts as active. Idle stretches are excluded, otherwise long pauses would compress the apparent intensity downward without reflecting anything about how the user was actually working.
The choice of sampling window matters. Short windows, on the order of one minute or less, capture bursts and recoveries clearly but produce noisy charts. Longer windows, on the order of five to fifteen minutes, smooth the noise but hide intensity spikes. Most tools settle on something in the one-to-five-minute range and then aggregate upward for daily and weekly views.
A second important choice is whether to weight events. An unweighted measure treats every keystroke, click, scroll tick, and mouse-move sample as a single event. A weighted measure scales each event type so that, for example, a click counts for more than a single mouse-move sample. Both approaches are reasonable. Unweighted measures are simpler and easier to compare across tools; weighted measures usually map better to perceived effort, at the cost of being less portable.
Teramind's documentation describes one well-known version of a weighted approach: a five-minute interval gets an activity percentage where one hundred percent corresponds roughly to forty words per minute of typing or comparable sustained mouse use. That is effectively an intensity measure dressed up as a percentage. Other tools express the same concept as keystrokes per minute or clicks per minute without the normalisation step, which keeps the units more transparent.
Common benchmarks
Published intensity benchmarks are scattered across several different research traditions: typing-test data, employee-monitoring vendor documentation, ergonomics white papers, and gaming benchmarks. The figures below are widely cited reference points; individual variation around them is large, and the underlying sources are not always directly comparable.
- The average adult typing speed is widely reported at roughly 40 to 52 words per minute, which translates to about 200 to 260 keystrokes per minute on the conventional five-characters-per-word convention. Professional data-entry roles often require sustained rates of 60 to 100 words per minute.
- Teramind treats roughly 40 words per minute, or equivalent sustained mouse use, as the threshold for a one hundred percent activity score within a five-minute interval. Lower sustained rates produce proportionally lower scores.
- Wellnomics, drawing on data from a large set of monitored organisations, reports that the average computer user generates fewer than 4,000 keystrokes per day. Averaged over a typical workday this is a notably low keystroke intensity, well under the rates seen in transcription or data-entry work.
- In real-time strategy and similar competitive games, casual play sits at roughly 40 to 80 actions per minute (a blended click-and-keystroke rate), solid amateur play sits around 100 to 180, and top professional StarCraft II players have been reported to sustain 300 to 500 or more actions per minute during intense sequences.
- Office click-rate norms are less well published than typing rates. Reference points cited by ergonomics vendors tend to sit in the low hundreds of clicks per hour for mixed office work, with much higher figures for design, CAD, and high-volume browsing tasks.
Anyone using these figures should treat them as broad orientation rather than precise targets. The most useful comparison for any one person is almost always their own intensity trend over time, segmented by application.
Examples
A few worked examples make the metric easier to read in practice.
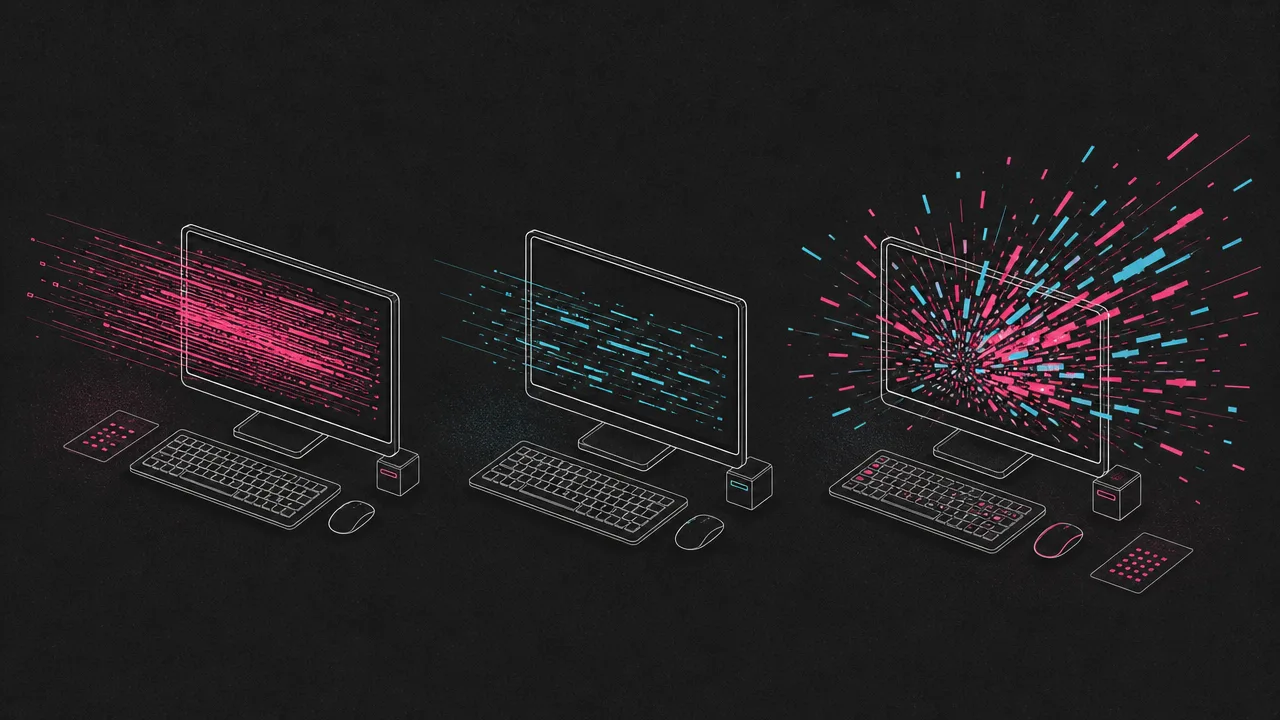
A data-entry specialist spends four active hours typing into a spreadsheet at a sustained 70 words per minute, with brief micro-breaks between records. Their keystroke intensity sits around 350 per active minute. Their click intensity is low. The blended events-per-minute figure is high and unusually flat, which is the signature pattern for sustained transcription work.
A designer spends the same four active hours in a vector-graphics tool. Their keystroke intensity is low, mostly modifier keys and the occasional rename. Their click and mouse-move intensity is very high, with large peaks during precision adjustments and lulls during canvas review. Total events per minute might match the data-entry specialist's, but the shape of the curve is completely different.
A competitive gamer plays for ninety minutes of active time. Within matches, their action rate exceeds 200 actions per minute and occasionally peaks above 400 during fights. Between matches, intensity drops to near zero for a minute or two before the next match begins. Averaging over the whole ninety minutes smooths these peaks; a one-minute sampling window shows them clearly.
Misconceptions
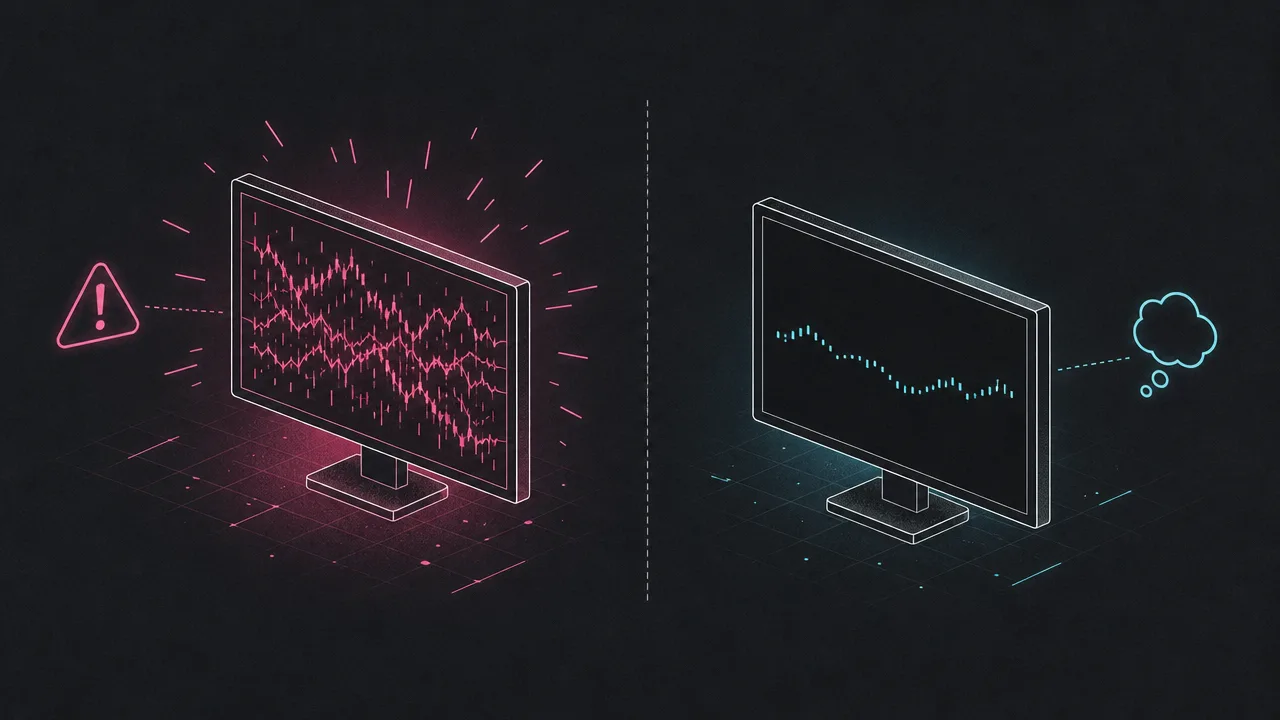
The most common misconception about input intensity is that high intensity equals productive work. For knowledge work this is almost always wrong. A reviewer reading a long document carefully, an architect sketching, or an engineer staring at a stack trace can all be doing valuable work at very low intensity. Conversely, a high-intensity day spent triaging notifications and toggling between chat apps may produce little of value despite looking impressive on an intensity chart.
A second misconception is that low intensity is automatically a problem. Deep work tends to be quiet: bursts of typing or clicking separated by long stretches of thinking. Tools that treat low intensity as a red flag tend to drive users toward visible busyness, which usually hurts the work the metric was trying to protect.
A third is that mouse jigglers and similar tools can fake intensity convincingly. They can keep active time alive at very low intensity, but the resulting pattern is usually uniform and machine-like, missing the burstiness and variance that characterises real human input. Intensity analysis that looks at the shape of the curve, not just its average, can distinguish the two without much difficulty.
Related concepts
Input intensity is one node in a small network of input-related metrics. Understanding it usually means understanding the others alongside it.
- Keystrokes: the cumulative keyboard event count that forms one half of the intensity numerator.
- Mouse clicks: the cumulative click count that forms the other primary half of the numerator.
- Input activity: the raw event stream from which intensity is derived.
- Active time: the denominator that turns raw counts into an intensity rate.
- Keyboard heatmap: a per-key view of where intensity is concentrated on the keyboard.
- Mouse heatmap: a per-region view of where click and movement intensity is concentrated on screen.
- Foreground application: the application against which intensity is attributed at any moment.
- Idle time: the periods excluded from the intensity denominator.
- Session length: the duration over which intensity is averaged for a single working stretch.
- Productivity metrics: higher-level scores that sometimes use intensity as one input.
Tracking input intensity
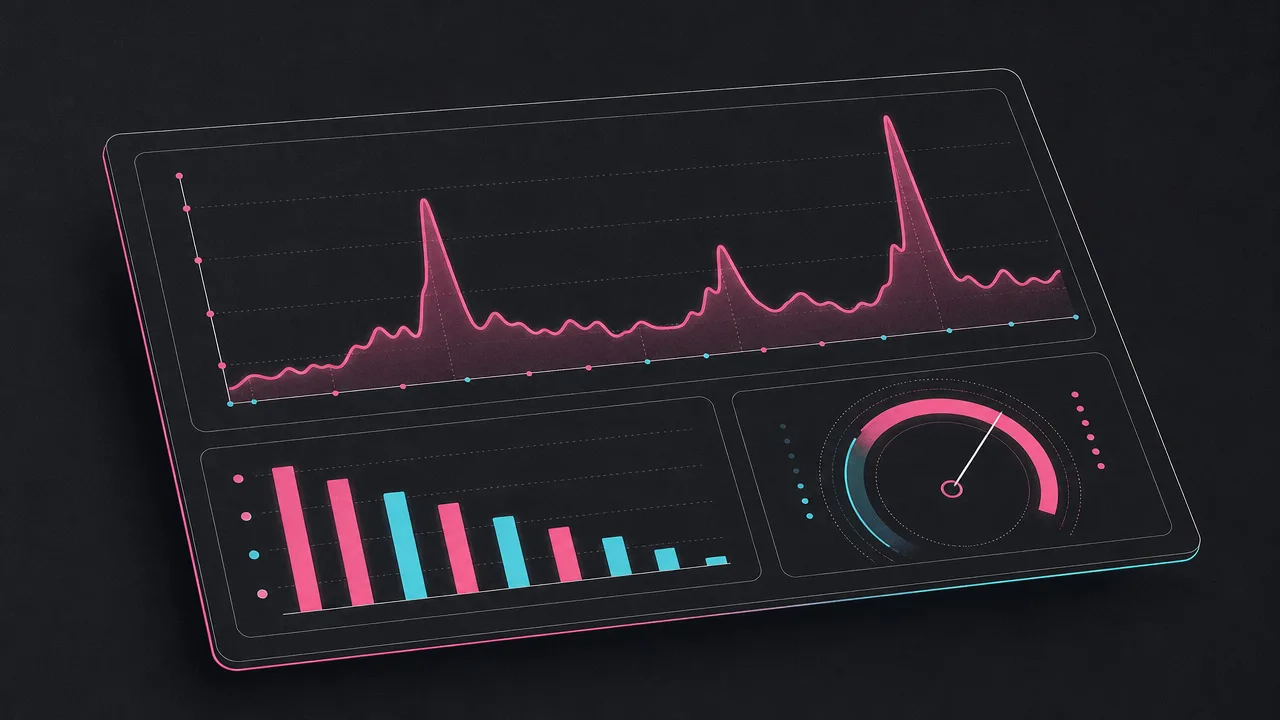
Input intensity can be tracked by any application with permission to observe operating-system input events. WhatPulse is one such application: it runs locally on Windows, macOS, and Linux, records keystrokes and mouse activity against the focused window, and reports them alongside active time so that intensity can be derived per application, per day, and over longer trends.
Because intensity depends on both the numerator (events) and the denominator (active time), it is sensitive to how each is measured. Consistent settings inside a single tool produce stable, comparable intensity series. Mixing data from different trackers with different idle thresholds or event-weighting rules is much less reliable, and is usually only useful as a rough orientation.
The most useful way to read intensity is as a personal baseline. Average values matter less than the shape of the curve over weeks: where the peaks are, which applications drive them, and whether sustained high-intensity stretches are paired with adequate breaks. That framing keeps the metric where it belongs, as a diagnostic signal rather than a score.
Frequently asked questions
Is input intensity the same as keystroke count?
No. A keystroke count is a total. Input intensity is a rate, normalised by active time. Two people with the same daily key count can have very different intensities if one of them was at the keyboard twice as long.
What counts as a single input event?
Most trackers count a keystroke, a mouse click, a scroll tick, or a mouse-move sample as one event. Some weight clicks and keystrokes equally, others apply different multipliers, which is one reason intensity numbers do not always agree across tools.
Is a higher input intensity better?
Not on its own. High intensity often correlates with data entry, gaming, or fast editing, and low intensity is normal during reading, design review, or deep thought. Intensity describes density of inputs, not the value of the work being done.
Can a mouse jiggler fake input intensity?
It can fake low-grade activity, but the resulting intensity profile is usually flat and uniform, which differs from the bursty pattern of real human input. Tools that look at intensity variance, not just totals, are harder to fool with jigglers alone.
How is input intensity different from active time?
Active time measures how long inputs were arriving. Input intensity measures how densely they arrived during that period. A person can have high active time and low intensity, or short active time at very high intensity.
Do keyboard and mouse intensity get measured separately?
Often, yes. Most analytics tools track keystrokes-per-minute and clicks-per-minute as distinct series, then sometimes combine them into a blended figure. Looking at them separately is usually more informative.
Is input intensity linked to repetitive strain risk?
It is one input among several. Ergonomics research from groups like Wellnomics suggests that sustained posture and lack of micro-breaks matter more than raw repetition, but very high sustained intensity without recovery is still a recognised risk factor.
Why does my input intensity vary so much between days?
Different work produces different intensities. A day of writing, a day of code review, and a day of spreadsheet entry will look very different even if total hours are similar. Trend lines over weeks are usually more meaningful than day-to-day values.
Conclusion
Input intensity is a rate, not a total. It describes how densely input events arrived during the time the user was actively present, and it captures something neither active time nor raw event counts can capture on their own. Used carefully, with separate views for keyboard and mouse and attention to the sampling window, it is one of the clearest fingerprints of how a person was working at any moment.
Used carelessly, as a stand-in for productivity or as a score to chase, it tends to reward visible busyness and punish the quiet work that often matters most. The honest reading is the one that treats intensity as a baseline signal, compared against a person's own history and paired with the rest of the picture.