Digital overload
The cumulative strain of too many tools, channels, and inputs.
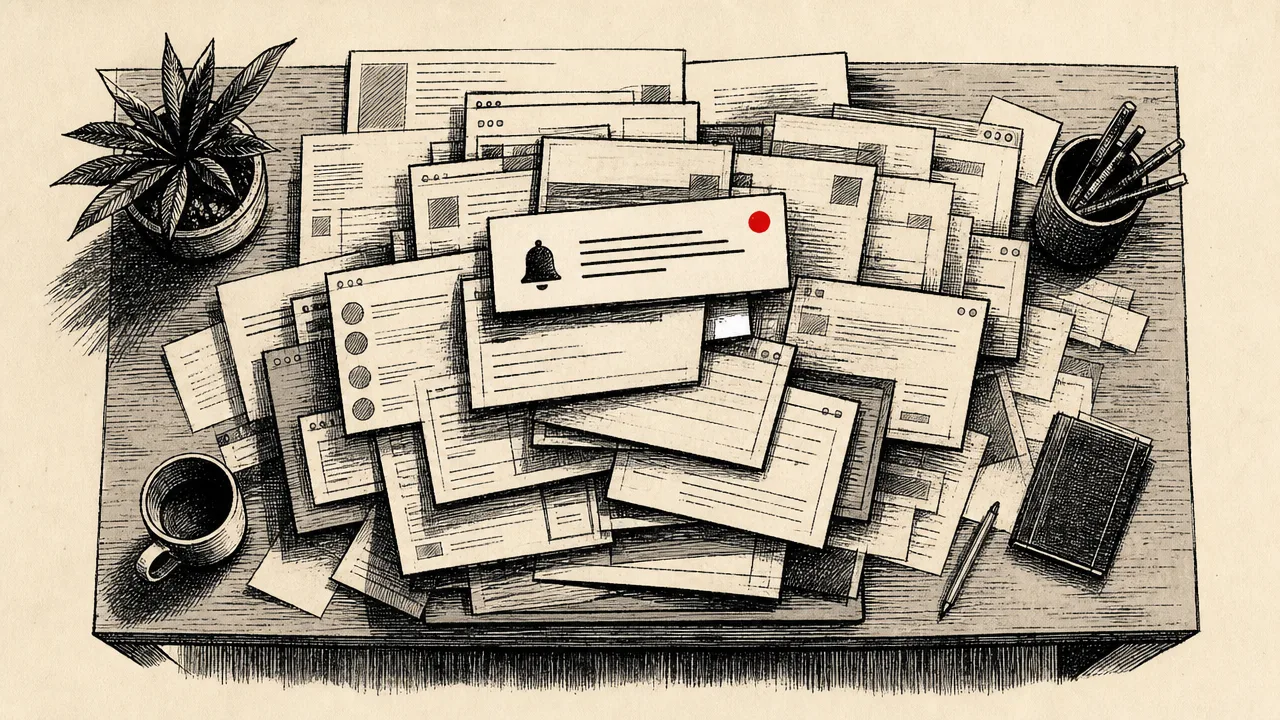
Digital overload is the cumulative strain that builds up when a person works across too many applications, communication channels, notification streams, and information sources at once. It is the umbrella term that covers everything from a cluttered taskbar to a packed inbox to the quiet pressure of being reachable on five different platforms after dinner. None of those things, on their own, is unusual. The overload is in the addition.
This page covers what digital overload is, why it has become a defining feature of contemporary knowledge work, how it can be identified and measured, the most commonly cited benchmarks, and the related concepts that sit underneath the umbrella. It is a hub article, so it references many sibling entries elsewhere in the Encyclopedia rather than restating them in full.
What is digital overload?
Digital overload describes the state in which the volume, variety, and pace of digital inputs a person encounters during a working day exceed their ability to process those inputs without strain. The strain shows up as fragmented attention, slower decision-making, longer working hours, and a general sense that more effort is producing less progress.
The term is deliberately broad. It is not the same as information overload, which is the older and narrower idea that a person has too much content to read or absorb. Digital overload also includes the tools themselves, the channels they expose, the notifications those channels emit, the switching cost between them, and the social norms that demand quick replies on each one. A worker can be subjected to digital overload without ever reading anything overwhelming. The fragments alone are enough.
Related vocabulary has accumulated around the same phenomenon. Linda Stone described continuous partial attention in the late 1990s, the state of paying partial attention continuously in order to be a live node on the network. Cal Newport popularised the idea of digital minimalism as a structural response to it. David Levy's work on mindful technology use named some of the same costs from a contemplative angle. Adam Alter cataloged the design choices that make digital products difficult to set down. Digital overload is the umbrella under which much of that work fits.
Why does digital overload matter?
The most direct reason is cognitive. Switching between tools, channels, and contexts is not free. Each switch leaves attention residue on the prior task, and the residue compounds across a day. By late afternoon, a worker who has touched a dozen apps and dipped into hundreds of small messages is operating with a thinner slice of attention than they started with, even if no single interruption was particularly serious.
The second reason is structural. Digital overload extends the working day at both ends. Microsoft's Work Trend Index research describes what it calls the infinite workday, in which a meaningful share of employees check messages before six in the morning and return to their inbox after ten at night. That is not a time-management failure on the part of individuals. It is the predictable result of a tool stack that emits signals across every waking hour and a culture that treats those signals as urgent.
The third reason is wellbeing. Sustained overload erodes the recovery time that buffers a person against ordinary work stress. It is not the same as burnout, but it is a documented precursor. Workers who report chronic digital overload also report higher anxiety, lower job satisfaction, and a more fragmented sense of what they actually did that day.
The fourth reason is economic. Asana's Anatomy of Work Index has repeatedly found that a large share of the working day is spent on what it calls work about work, the coordination, status updates, and tool wrangling that surround actual production. Some of that coordination is unavoidable. The overload-driven portion is not, and it represents a real cost that any team carries whether or not it shows up on a balance sheet.
How is digital overload identified or measured?
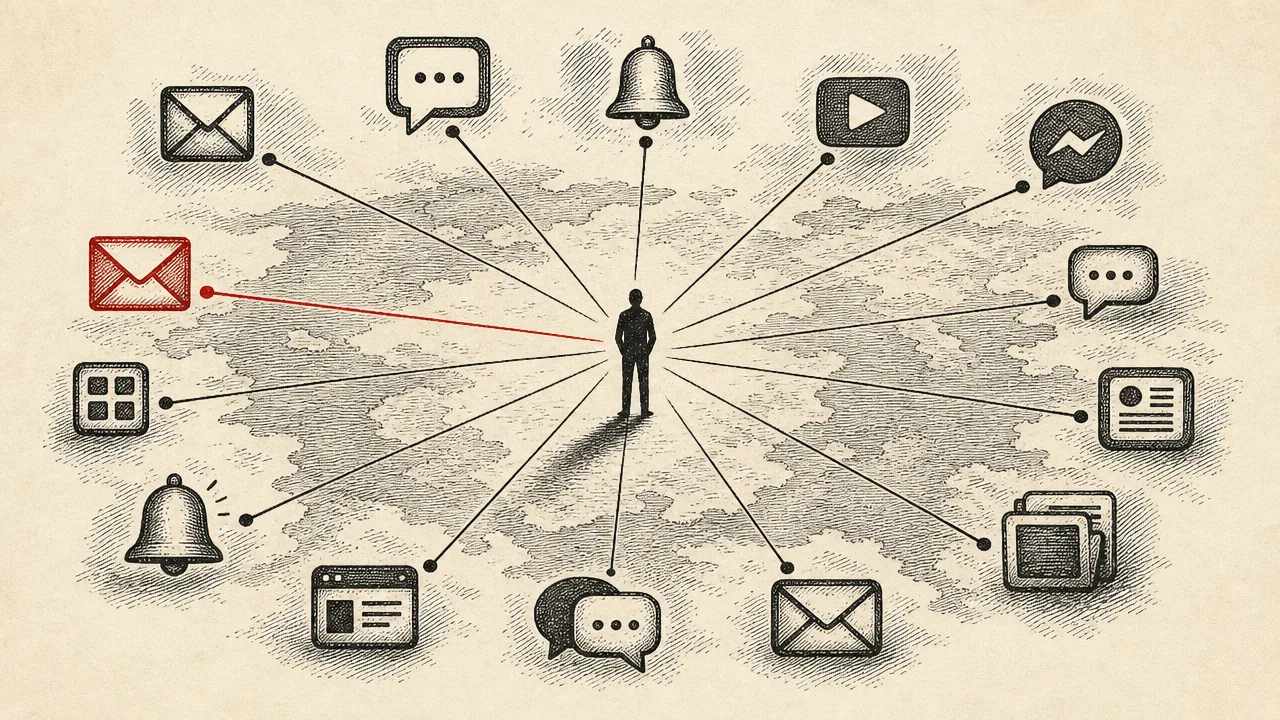
No single metric captures digital overload, because it is a compound condition. The honest approach is to combine several signals and look at the picture they make together. Four signal families are widely used.
The first is the count of distinct applications a person uses in a typical day or week. Application sprawl is the most visible component of overload and the easiest to track. Computer activity tools can record every foreground application that received input during the day, which makes the count concrete rather than anecdotal.
The second is the number of communication channels active for the same person. Email, one or more team chat tools, project management comment threads, video meetings, direct messages from collaborators, and external channels such as customer-facing platforms all count. Each new channel multiplies the surface area on which the person must remain reachable.
The third is the notification rate, both incoming events per hour and the share of those events that trigger a context switch. A worker who receives many notifications but processes them in deliberate batches is in a different state than one who reacts to each as it arrives. The latter is closer to continuous partial attention.
The fourth is late-hour engagement. The clearest behavioural marker of digital overload is the extension of the working day into evenings, early mornings, and weekends. Active time, application usage, and input activity recorded outside conventional hours all serve as proxies for the infinite workday pattern.
Taken individually, none of these signals is decisive. A high application count can simply reflect a complex role. A high notification rate can be absorbed by good batching. Late-hour activity can be a one-off. Taken together, and tracked over weeks rather than days, the four signals form a reasonable composite picture of how much a person is being asked to handle.
Common benchmarks
Benchmarks for digital overload are softer than benchmarks for narrower metrics like active time, but several reference points are widely cited. The figures below are drawn from public summaries of the named research and should be read as rough population averages, not personal targets.
- Asana's Anatomy of Work Index reports have placed the average knowledge worker on roughly nine to ten distinct work applications, with public summaries noting that workers switch between around ten apps approximately twenty-five times per day.
- The same Asana research has flagged a measurable communication-loss threshold at around six applications, beyond which the share of workers who miss messages and tasks rises noticeably.
- Microsoft's Work Trend Index 2025 report, including the Breaking Down the Infinite Workday analysis, describes employees being interrupted roughly every two minutes during the workday, with daily incoming messages, emails, and meeting requests summed in the low hundreds per person.
- The same Microsoft research has reported that roughly forty percent of employees check email before six in the morning and nearly a third return to it by ten at night, and that around two thirds of workers feel they lack enough uninterrupted focus time.
- Industry summaries based on Atlassian and Slack data and on prior Asana surveys have placed average meeting load for knowledge workers in the range of roughly fifteen hours per week, with specific figures varying by year and methodology.
These numbers move year to year and study to study. The useful pattern is not any single figure but the consistent direction: more tools, more channels, more interruptions, and more after-hours engagement than the same research described a decade ago.
Examples
Three scenarios show how the components combine in practice.
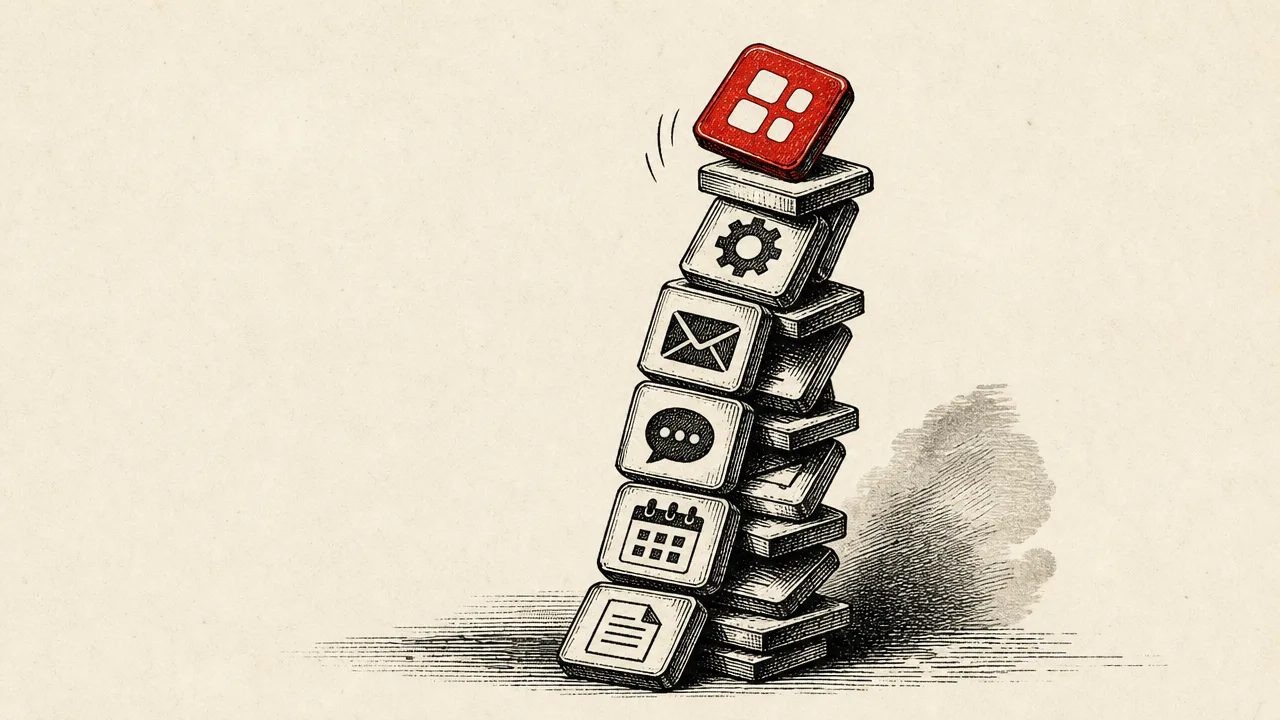
A marketing manager starts the morning in email, moves to a project management tool to update tasks, opens a design tool to review files, jumps into a team chat to answer a question, joins a video meeting, returns to email, opens a spreadsheet for a quick number, and pivots to a customer support tool to follow up on a ticket. None of those moves is wrong. The overload is the count: nine context switches across seven applications before lunch, with notifications continuing to arrive in the background of all of them. The day will produce work, but the manager will end it feeling busy without being able to name what they completed.
A software engineer works in a smaller tool stack, perhaps an editor, a terminal, a browser, and a single chat tool, but is on call for incidents. Notifications arrive infrequently, but each one demands an immediate pivot. The application count is low. The notification urgency and the late-hour engagement are high. The engineer is in a different shape of digital overload than the marketing manager, but the strain is comparable.
A team lead has a calendar that fragments the day into thirty-minute blocks between meetings, each block colonised by quick replies across email and chat. The number of tools is moderate. The number of channels and the rate of switching are extreme. Late-hour engagement is high because actual focused work happens after the meetings finish. The lead's experience matches what Microsoft has described as the infinite workday pattern, and the strain is mostly structural rather than self-imposed.
Misconceptions
The most persistent misconception is that digital overload is simply too much information. That framing is almost a century old and predates personal computing. The contemporary version of the problem is not the volume of content. It is the volume of channels, tools, and switching events through which that content arrives, and the social expectation of near-immediate response on each one. A person can read fewer pages than they did twenty years ago and still be more overloaded.
A related misconception is that overload is purely a matter of personal choice. Choice does play a role, and Linda Stone's description of continuous partial attention emphasises the human desire to remain a live node on every available network. But most of the load is structural: a team that runs on five channels imposes five channels on every member, regardless of preference. Telling an individual to focus more, in that setting, is asking them to absorb the strain rather than reducing it.
A third misconception is that switching cost is negligible because each switch is short. Decades of cognitive research, summarised in modern treatments of cognitive load theory, are clear that switching has a measurable residue. The cost per switch is small, and the daily total is not.
A fourth misconception is that digital overload is solved by adopting another tool, particularly one with promises about consolidation or artificial intelligence. New tools usually add channels rather than replacing them, and most of the documented reductions in overload come from removing tools, narrowing channels, and changing defaults, not from layering further software on top of the stack.
Related concepts
Digital overload sits at the top of a small family of related ideas. Most of them have their own entries in this Encyclopedia and can be read alongside this article.
- Notification fatigue: the dulling effect of receiving so many alerts that meaningful ones are missed.
- Tab hoarding: the accumulation of open browser tabs as an external memory store that quietly adds load.
- Doomscrolling: compulsive consumption of negative content streams, a behavioural symptom of overload.
- Screen fatigue: the physical and visual exhaustion that follows long, fragmented screen days.
- Focus fragmentation: the breakdown of continuous focus time into short, low-value slices.
- Workday fragmentation: the equivalent pattern at the level of the calendar rather than the application.
- Attention residue: the lingering cognitive cost of an unfinished task after switching away from it.
- Context switching: the act of moving between applications, projects, or modes of work.
- Application switching: the narrower, measurable version of context switching at the OS level.
- Deep work: the long, undistracted focus blocks that digital overload most directly displaces.
Underneath these, the basic computer-activity vocabulary still applies. Active time, idle time, foreground application, input activity, session length, and application usage all contribute pieces to a measured picture of digital overload, while focus time and input intensity sit on the opposite side of the same coin. Reading those entries alongside this one gives a fuller view than any single article can.
Tracking digital overload
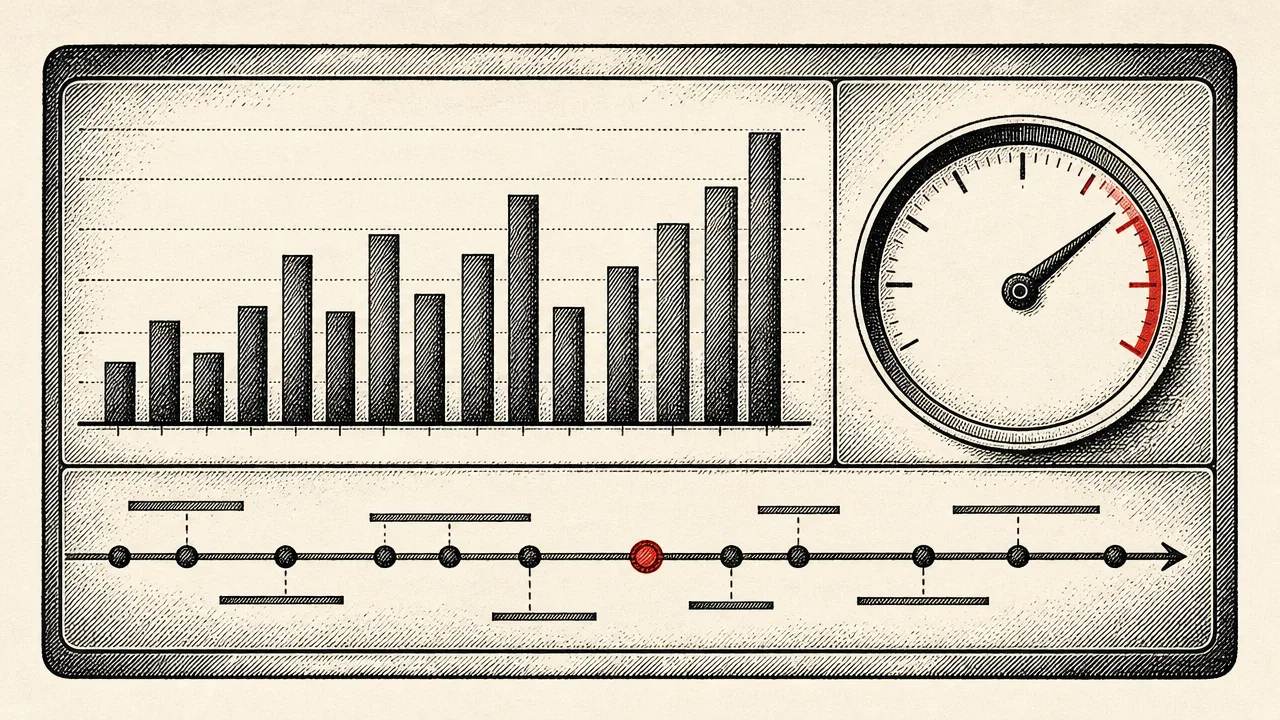
Because digital overload is a composite condition, tracking it usually means combining a few simple measurements rather than relying on one number. A computer activity tracker that runs locally on the device is well placed to collect those measurements without adding another channel to monitor. WhatPulse is one such tool. It records the foreground application against active time, captures keystrokes and clicks as input activity, and accumulates application usage over days, weeks, and years.
From that raw data, useful overload signals emerge naturally. The count of distinct applications used per day is directly visible. Application switching frequency can be derived from foreground changes. The shape of the day, including how much activity happens before nine in the morning or after ten at night, falls out of the same active-time stream. None of these numbers describe overload by themselves, but together they outline it.
The purpose of looking at the data is not to score a worker against an external benchmark. It is to make a condition visible that would otherwise be invisible. A person who can see, in their own dashboard, that they touched twenty applications and worked across nine evenings last month is better placed to decide what to change than one who only senses, vaguely, that the year has been heavy. The point of tracking is the decision, not the number.
Frequently asked questions
Is digital overload the same as information overload?
No. Information overload describes the volume of content a person needs to process. Digital overload is broader and also covers the number of tools, channels, notifications, and switching events that produce that content, along with the attentional cost of moving between them.
How many work applications is too many?
There is no universal threshold. Asana's Anatomy of Work Index has reported averages near nine to ten apps per knowledge worker, with measurable communication losses appearing once people pass six. The honest answer is that the threshold depends on the person, the role, and how much switching the toolset forces.
Can a digital detox solve digital overload?
Temporarily, yes, but the strain returns when the same tools and channels resume. Authors like Cal Newport in Digital Minimalism argue for permanent structural changes to which tools are used and on which terms, rather than periodic abstinence followed by relapse.
Is digital overload a clinical condition?
No. It is a descriptive label for a pattern of strain, not a recognised diagnosis. It overlaps with documented constructs such as cognitive load, attention residue, and burnout, but should not be confused with any of them on its own.
Does adding another tool ever reduce digital overload?
Rarely. Most new tools add another channel, another notification stream, and another window to monitor. Genuine reductions usually come from removing tools, consolidating channels, or changing defaults, not from layering a new productivity application on top.
Is digital overload mostly an individual problem or a team problem?
It is primarily structural. Most of the strain comes from norms set by teams and organisations, such as which channels are expected to be monitored, how quickly replies are expected, and how many tools a role requires. Individuals can soften the effect, but the root cause usually sits above them.
How does digital overload relate to burnout?
It is a contributing factor, not a synonym. Sustained digital overload erodes recovery time, fragments attention, and extends the working day, all of which are known precursors to burnout. Burnout itself is the broader exhaustion and disengagement state.
Can computer activity tracking make digital overload worse?
It can, if the data is used to push for more visible activity or faster response times. Used for personal insight rather than surveillance, the same data can do the opposite, by surfacing the scale of switching and channel use that would otherwise stay invisible.
Conclusion
Digital overload is the umbrella under which most other contemporary complaints about work attention live. It is not exactly information overload, not exactly burnout, and not exactly multitasking. It is the compound effect of too many tools, too many channels, too many notifications, and a working day that no longer fits within working hours. The phenomenon has been described under different names since at least Linda Stone's continuous partial attention in the late 1990s, but the evidence assembled by Microsoft, Asana, and a growing body of academic work suggests that the underlying pattern has intensified rather than stabilised.
No single metric will capture it. A small set of measurable signals, application count, channel count, notification and switching rate, and late-hour engagement, will. Used carefully, on a person's own data and over a long enough window to see trends, those signals turn an abstract condition into something a worker or a team can actually act on.