Application usage
Time spent in each application, sliced by day, week, or project.
Application usage is the breakdown of computer time by which application a person was working in. It answers a deceptively simple question: where did the day actually go? Almost every analytics tool reports an application-usage list, but the rules that produce it, what counts as a single application, how browser tabs are handled, and what happens during idle stretches, vary considerably between tools.
This page covers what application usage is, how it is measured, the benchmarks that exist for it, the common pitfalls of interpreting it, and the metrics that sit next to it in the broader vocabulary of computer-activity analytics.
What is application usage?
Application usage is the cumulative active time spent with a specific application as the foreground window. Every moment of input, every keystroke, click, and scroll, is attributed to whichever application owned the focus at that instant. Summed across a day, a week, or a project, the result is a per-application time budget.
The metric is built from two simpler signals. The first is the same idle-threshold logic that produces active time, which decides whether the user is engaged at all. The second is the focused-window identity, which decides which application the engagement is credited to. Without the second signal, you only know that the person was working. With it, you know what they were working on.
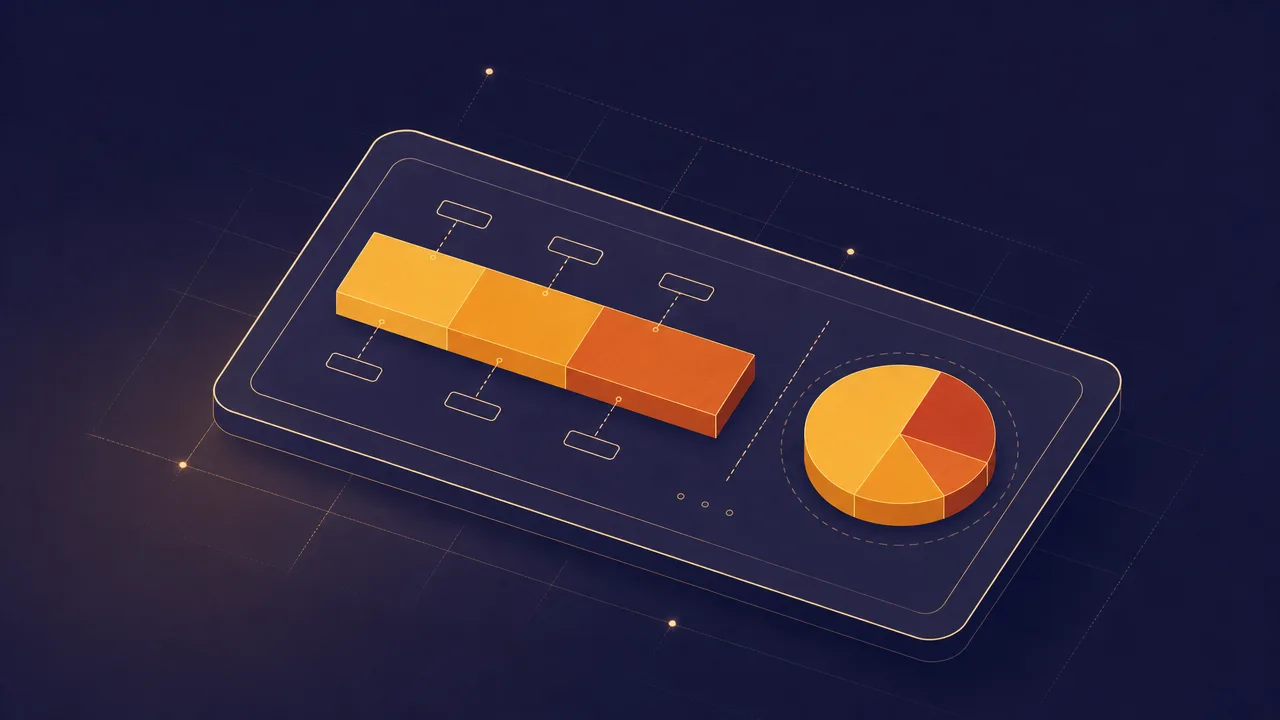
Application usage is also non-overlapping by construction. Only one window holds the foreground at any instant, so the totals across all applications add up to total active time. That neat additive property makes the metric easy to chart as a stacked bar, a pie, or a category breakdown, and it is one reason application usage has become the default lens for personal analytics dashboards.
Why does application usage matter?
Application usage is the metric that turns a generic time tracker into something a person actually finds interesting. Knowing the day produced six hours of active time is mildly useful. Knowing that four of those hours went to a browser, ninety minutes to a chat client, and twenty-five minutes to the editor is something else. The breakdown forces a confrontation between intention and behaviour.
For individuals, application usage exposes drift. Self-reports about which tools dominate the workday are systematically wrong, usually in the same direction: people remember the deep work and forget the toggling. A clean usage breakdown shows the messenger window that quietly absorbs ninety minutes a day, the browser tab that became a habit, the editor that gets less time than it deserves.
For teams and organisations, application usage tends to be used to understand tool adoption, surface duplicate purchases, and identify where workflows are fragmented across too many surfaces. Used carelessly it becomes a surveillance signal, and the more thoughtful tools restrict the breakdown to aggregate categories rather than per-user titles for exactly that reason.
How is application usage measured?
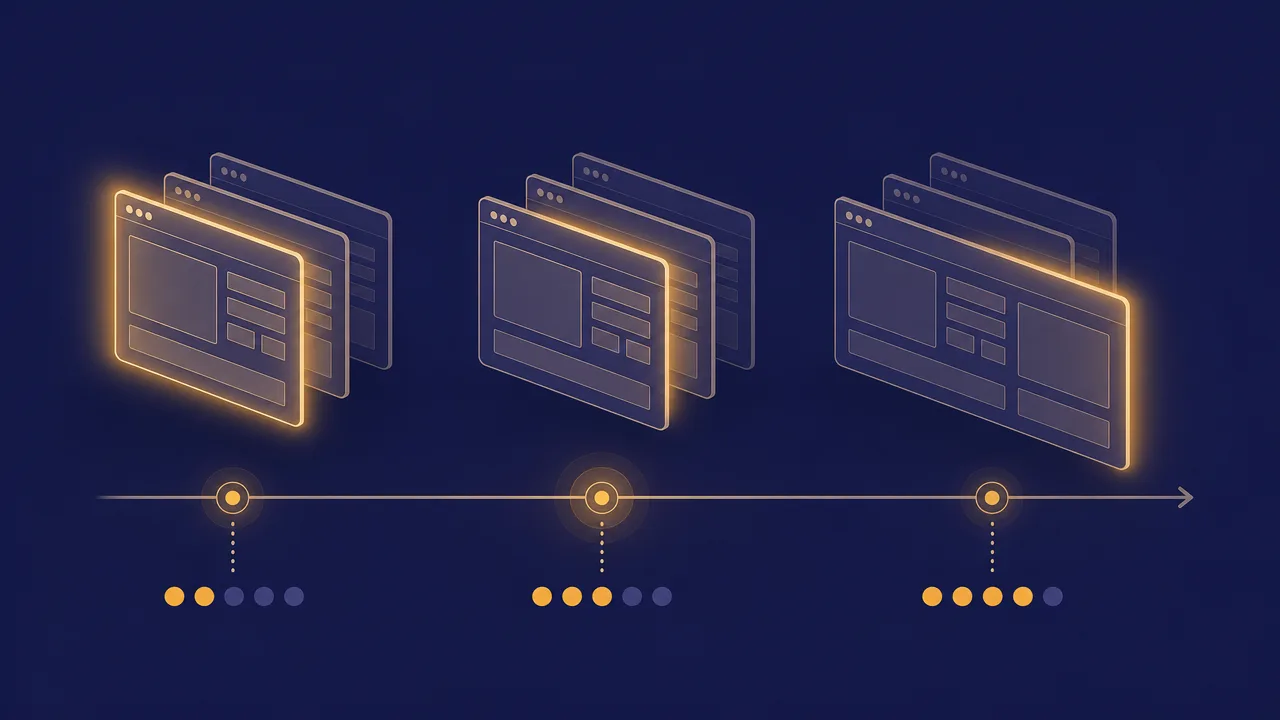
The underlying mechanism is foreground tracking. The tracker subscribes to operating-system events that fire whenever the focused window changes. Each time the foreground changes, the previous window's accumulated time is closed out and a new accumulator opens against the new window. The result is a precise per-window timeline.
The first implementation choice is how to identify an application. The conservative approach uses the executable name: chrome.exe, code.exe, slack.exe. That produces stable, comparable totals but lumps wildly different activities together. The more informative approach also reads the window title, so a code editor's time can be split by project file and a document app's time by document. The richest approach combines both and adds category lookups, mapping each executable or title to a semantic group like Development, Communication, or Entertainment.
Browser attribution is the second consequential choice and the place where most trackers diverge sharply. A naive implementation credits all browser activity to the browser executable, which is technically correct and analytically useless. Better implementations read the active tab's title or URL and attribute time to the specific site or web application instead. That distinction is what separates a tracker that tells you you spent four hours in Chrome from one that tells you three of those hours were in a single project management tool.
A few subtleties are worth knowing. Application usage is calculated locally on the device and does not require a network connection. Multi-monitor setups do not change the rules; only the focused window matters. Background applications consuming CPU but receiving no focus do not produce usage time. And applications that hold the foreground while the user goes idle stop accumulating once the idle threshold is crossed, which prevents a forgotten window from inflating the totals overnight.
Common benchmarks
Published benchmarks for application usage tend to mix together survey data, telemetry-based studies, and vendor reports, each measuring slightly different things. The figures below are the most commonly cited reference points, with the caveat that individual variation is enormous and the right comparison is almost always a person's own trend over time.
- Knowledge workers spend approximately five hours per day on their computers, excluding meetings, calls, and mobile time, according to RescueTime's longitudinal user data.
- A 2022 Adobe survey found that most workers report spending around three hours per day on communication tools like email and Slack, roughly 37% of an eight-hour day.
- Among heavy Slack users, 62% spend more than three hours per day in the application, and 18% spend more than seven hours, according to Slack's own usage data.
- A 2022 Harvard Business Review article reported, based on Qatalog and Cornell research, that digital workers toggle between applications and windows around 1,200 times per day on average, which works out to roughly one switch every twenty-four seconds of active time.
- Asana's Anatomy of Work Index has reported that workers use an average of around ten distinct applications per workday, a figure that has been rising year over year in the same dataset.
- Microsoft's 2025 Work Trend Index found that employees are interrupted around 275 times per day by meetings, emails, and chats, with edits to Office documents spiking in the minutes immediately before scheduled meetings.
These figures describe populations, not individuals, and they were collected with different methodologies. A 1,200-switches-per-day estimate from one study and a 720-per-day estimate from another are both plausible, depending on what counts as a switch and how aggressively short focuses are filtered out.
Examples
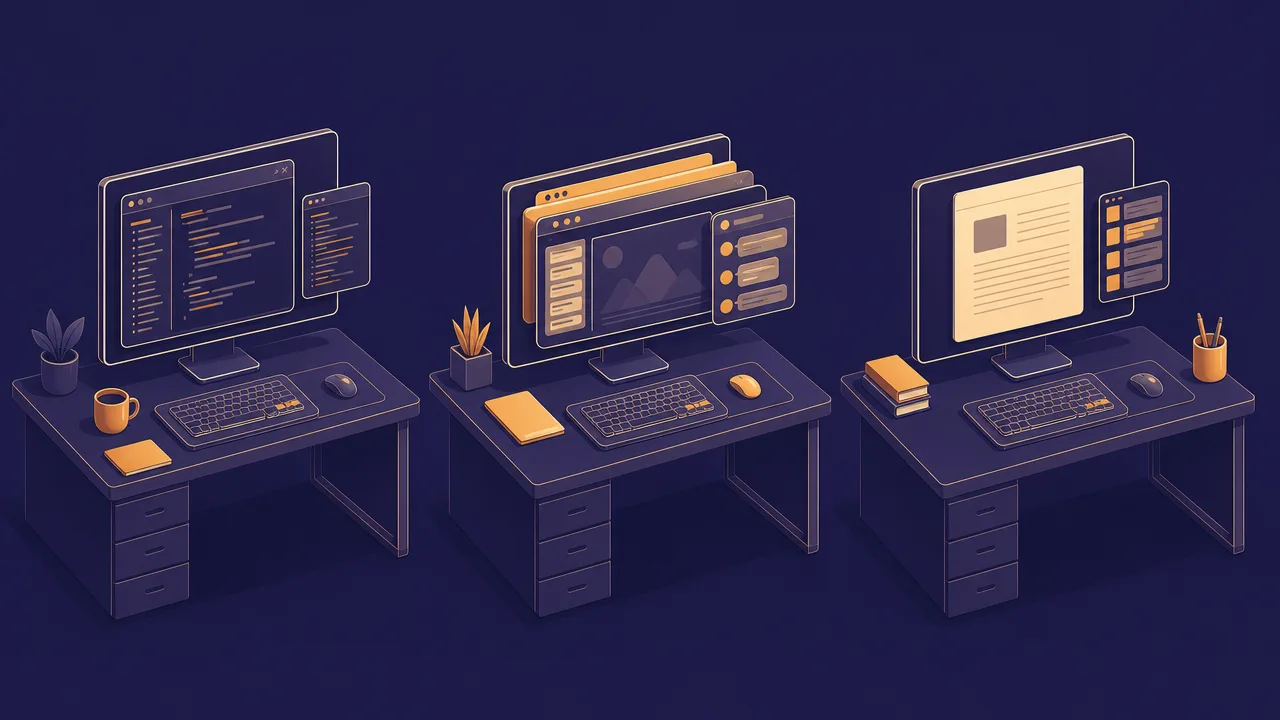
Three worked examples illustrate how application usage behaves in practice.
A backend developer starts at 09:00 in a code editor and accumulates two and a half hours against it across the morning, interrupted only by short visits to a terminal (forty minutes), a browser tab for documentation (thirty minutes), and a chat window (twenty minutes). After lunch, a review meeting pulls most of the afternoon into a video-call application (ninety minutes), with the editor reclaiming the last hour of the day. The usage breakdown looks coherent: editor dominant, communication secondary, browser as a research surface.
A content marketer spends the same day with the browser as their primary surface. A naive tracker reports six hours in Chrome. A title-aware tracker splits that total into ninety minutes in a content management system, ninety minutes in an analytics dashboard, an hour in a project tracker, an hour in email, and the rest scattered across research tabs. The total time is identical, but the second breakdown is the one that suggests where the workflow could be consolidated.
A graduate student writing a thesis spends seventy-five percent of their active time in a single word processor, the remainder split between a PDF reader, a reference manager, and short browser excursions. The usage chart is almost boring: one tall bar and a few small ones. That shape, however, is exactly what a long writing session should look like, and it makes the days where the chart fragments into a dozen small bars easy to spot.
Misconceptions
The most common misconception is that application usage is a measure of productivity. It is not. The application that absorbs the most time is rarely the one producing the most value, especially in roles where the deepest work happens in editors and IDEs while attention is fragmented across messengers and browsers. Time-in-app is a signal about behaviour, not about output.
A second persistent error is treating the application list as a complete picture of the workday. Meetings, phone calls, reading on paper, and time on mobile devices do not appear in application usage at all. A workday that looks light in the breakdown may have been entirely full; the metric simply cannot see anything that happened away from the focused desktop window.
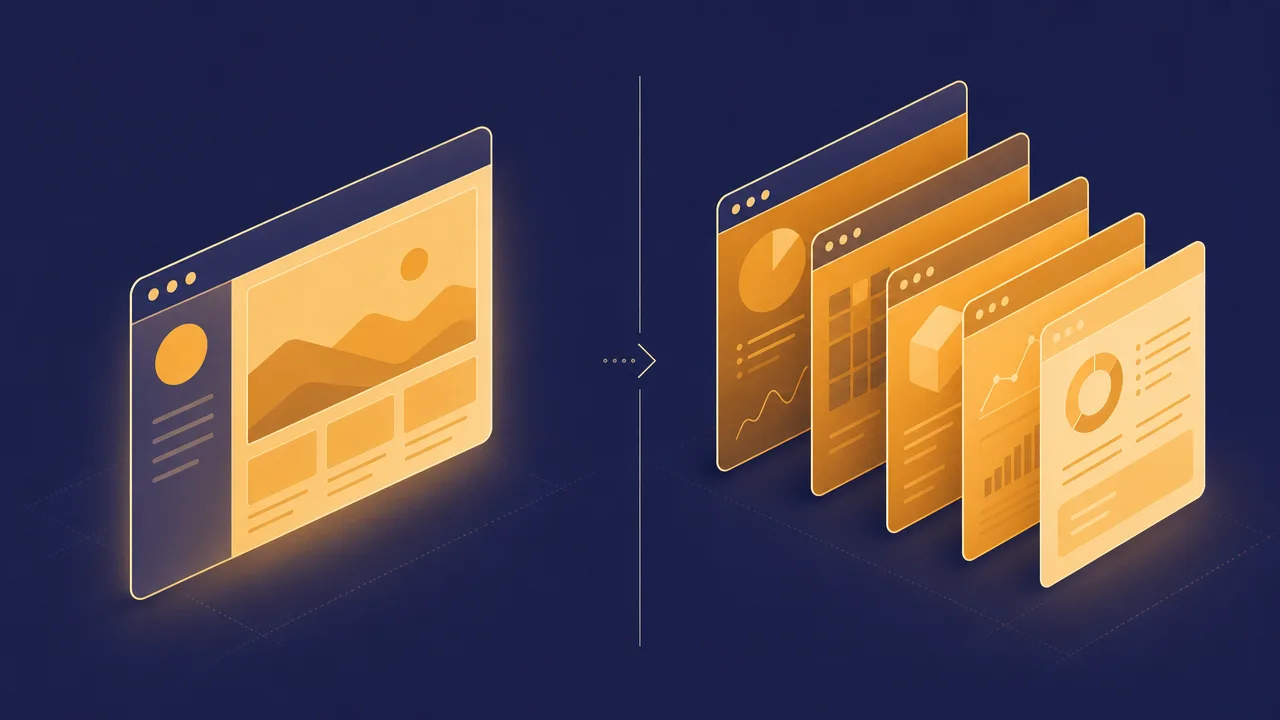
A third misconception is that the browser line on a usage chart represents a single activity. For most modern workers, the browser is the operating system for half their working life, and lumping it together hides more than it reveals. Any serious interpretation of application usage in 2026 has to treat the browser as a category to be split, not a single application to be summed.
A fourth, subtler error is comparing usage totals across different tools. Trackers differ on idle thresholds, on whether they read window titles, on browser-tab attribution, and on how they handle brief focus changes. Within one tool the numbers are internally consistent and useful. Across tools, they should be treated as approximations.
Related concepts
Application usage sits in the middle of a small network of related metrics. Most analytics dashboards reference several of these alongside it, and they tend to be easier to read together than alone.
- Active time: the total input time across all applications, of which application usage is the per-application decomposition.
- Foreground application: the window currently in focus, which is what attributes time to a specific application.
- Application switching: the rate at which the foreground application changes, the counterpart to time-in-app.
- Usage distribution: the shape of the application breakdown, often visualised as a stacked bar or treemap.
- Usage analytics: the broader practice of analysing application usage data for trends, anomalies, and habits.
- Context switching: the cognitive cost of moving attention from one application to another.
- Focus time: continuous time in a single application without switching, the inverse of fragmentation.
- Activity tracking: the umbrella category of techniques used to record application usage and related signals.
- Productivity metrics: the higher-level scores that often take application usage as one input.
- Workday fragmentation: the qualitative pattern application-usage charts make visible.
Tracking application usage
Application usage can be recorded by any tool with permission to observe the operating system's foreground window and input events. WhatPulse is one such tool: it runs locally on Windows, macOS, and Linux, records time against the focused window, and lets the user inspect the result per application, per day, per week, and over longer periods.
Because the recording happens on the device, no network connection is required for the measurement itself. Users can configure the idle threshold to match their working style, choose whether to retain window titles or only executable names for privacy, and decide whether the data stays purely local or syncs to a personal dashboard for longer-term trend analysis. The browser attribution layer maps web-application activity to specific sites rather than crediting all of it to the browser executable.
The point of tracking application usage, in this context, is not to score the day or to compare against other people. It is to make the actual shape of the workday legible to the person living it, so the patterns that compound over months become something they can see, name, and decide what to do about.
Frequently asked questions
Is application usage the same as active time?
No. Active time is the total duration of input across all applications. Application usage breaks that total down by which application held the foreground at each moment.
How are browser tabs counted?
It depends on the tracker. Some report all browser time under a single executable like chrome.exe. Better implementations read the active tab title or URL and attribute time to the specific site instead of the browser as a whole.
What about applications running in the background?
Background processes do not accumulate application-usage time. The metric is tied to whichever window has the foreground, regardless of how many other applications are running.
Does application usage include time on second monitors?
Only the focused window counts, even across multiple monitors. A reference document open on a second screen produces no application-usage time unless it is the active window.
Can the same time be counted toward two applications?
No. The foreground is exclusive at any given instant, so application usage is non-overlapping by construction. Total application-usage time across all applications equals total active time.
Why do my application-usage totals look lower than expected?
Idle stretches and time spent without a focused window are excluded. Meetings, phone calls, and reading away from the keyboard do not accumulate against any application.
Does application usage work offline?
Yes. Application usage is derived from local window-focus and input signals and does not require a network connection to be recorded.
How is application usage different from screen time?
Screen time usually refers to the total period a display is on. Application usage is the subset of that time spent with a specific application focused while input is being provided.
Conclusion
Application usage is a precise decomposition of active time by foreground window. It is the metric that makes a usage tracker feel like it knows something about the workday rather than just measuring it. As a mirror on actual behaviour it is hard to beat, and the longer the trend is recorded, the more honest the reflection becomes.
It is not a measure of productivity, output, or value, and using it as one tends to encourage time spent in the easiest-to-quantify applications rather than the most useful ones. Interpreted as a behavioural signal, paired with focus and switching metrics, and compared against a person's own history, application usage is one of the more useful numbers a computer-activity tracker produces.