Activity trends
How daily and weekly activity changes over months and years.
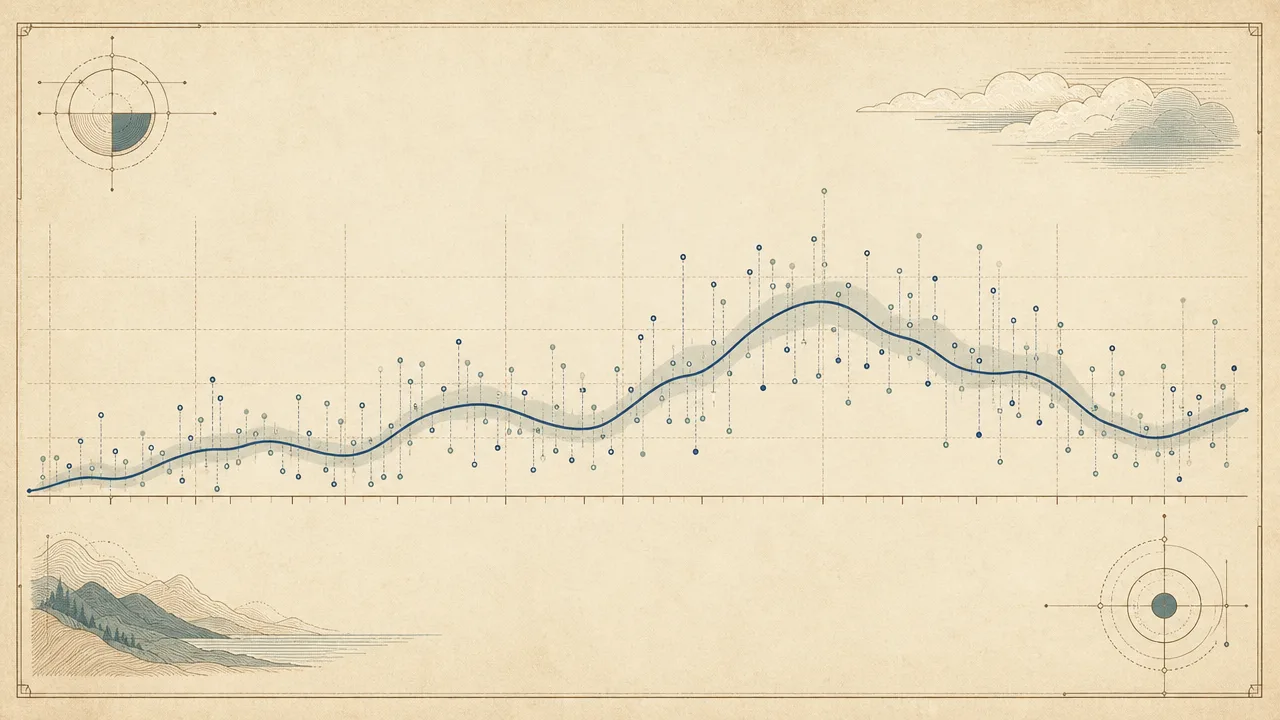
Most discussions about computer activity stop at the day. How many hours of active time did you log, how many keystrokes, how many applications did you switch between. Activity trends look at the same data from a longer distance. They ask what your usage looks like once it has been smoothed over weeks, compared against the same period a year earlier, and stripped of predictable rhythms like weekends or holiday slowdowns.
This page explains what activity trends are, how they are derived from raw daily metrics, what benchmarks exist in the published research, and where the common pitfalls sit. The short version is that a single day tells you almost nothing, and a year of days tells you a great deal.
What are activity trends?
An activity trend is the long-term shape of an activity metric. Rather than asking what happened on a given Tuesday, it asks what has been happening to your Tuesdays over the past six months, or how this quarter's typical week compares with the same quarter last year. The unit of analysis stops being the day and becomes the moving window.
Trends are built on top of the same raw signals that produce daily numbers: active time, keystrokes, mouse activity, application usage, focus blocks, and so on. The processing changes, not the data. A trend view typically smooths the raw daily series with a rolling average, separates predictable cycles from directional movement, and only then asks whether something is rising, falling, or stable.
Three properties matter when reading a trend. Direction is whether the metric is going up, down, or sideways. Seasonality is the repeating pattern inside the series, such as lower weekend usage or a December slowdown. Regime shifts are structural breaks where the underlying pattern changes, usually because something in life or tooling changed. A well-built trend dashboard makes all three visible at once.
Why do activity trends matter?
Single-day numbers are extremely noisy. A bad night of sleep, an unusually long meeting, a quiet morning, an urgent project: any of these will move a daily total by a meaningful percentage without saying anything about how the person actually works. Looking at one day and drawing a conclusion is almost always a mistake.
Trends filter out that noise. A four-week rolling average of active time, for example, will barely register a single chaotic Wednesday. A year-over-year comparison will surface whether your November is genuinely heavier than last November, or whether it only feels that way because the most recent week was rough.
For individuals, this longer view is where most of the useful self-knowledge sits. The questions worth asking are rarely about today. They are whether focus blocks have been shrinking month after month, whether evening work has been creeping later, whether a new tool actually changed how time is spent, or whether the post-vacation bounce is real and lasting or a brief reset. For teams, trends are how patterns like sustained overload or eroding break habits become visible before they turn into burnout or attrition.
How are activity trends derived?
The starting point is a clean daily series for whichever metric you care about. Most trend analysis is run on active time, focus time, application categories, keystrokes, or some derived ratio such as the share of the day spent on communication tools. The day is the smallest unit because anything finer tends to be dominated by within-day rhythm rather than long-term change.
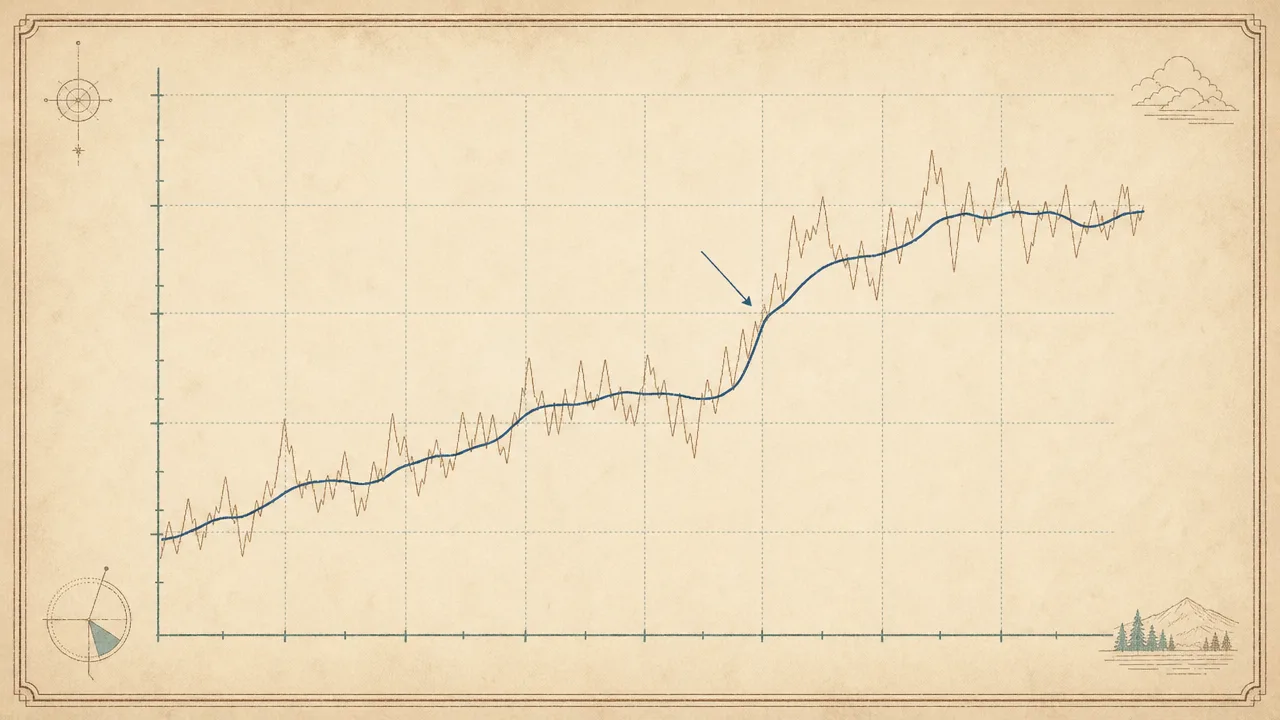
The first transformation is smoothing. A seven-day rolling average removes weekday-versus-weekend whiplash and is the most common default. A twenty-eight day average smooths over individual weeks and reveals slower shifts. Both are useful, and they are usually shown together. The aim is not to hide the daily numbers but to make the underlying direction readable.
The second step is separating seasonality from trend. At a high level this means estimating the repeating component of the series, such as a typical Monday or a typical December, and subtracting it from the raw values so that the remainder reflects only directional movement. Statisticians have formal tools for this, such as STL decomposition, but the underlying idea is intuitive: a Saturday is expected to look like other Saturdays, so a Saturday only tells you about a trend when it differs from that expectation.
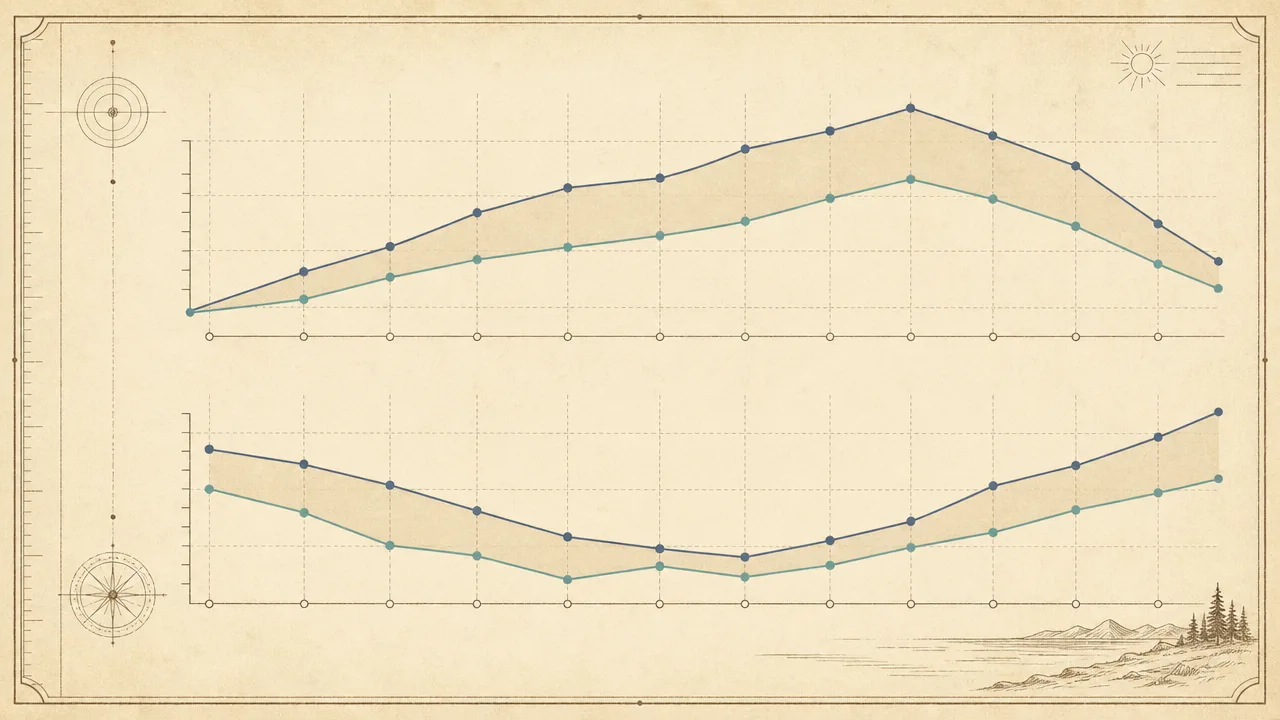
The third step is year-over-year comparison. Aligning this week with the same week last year, and the same month with the same month, controls for seasonality without any modelling at all. It is the simplest credible way to ask whether something has actually changed, and it is what most published "this year versus last year" workplace studies rely on, including Microsoft's annual Work Trend Index comparisons.
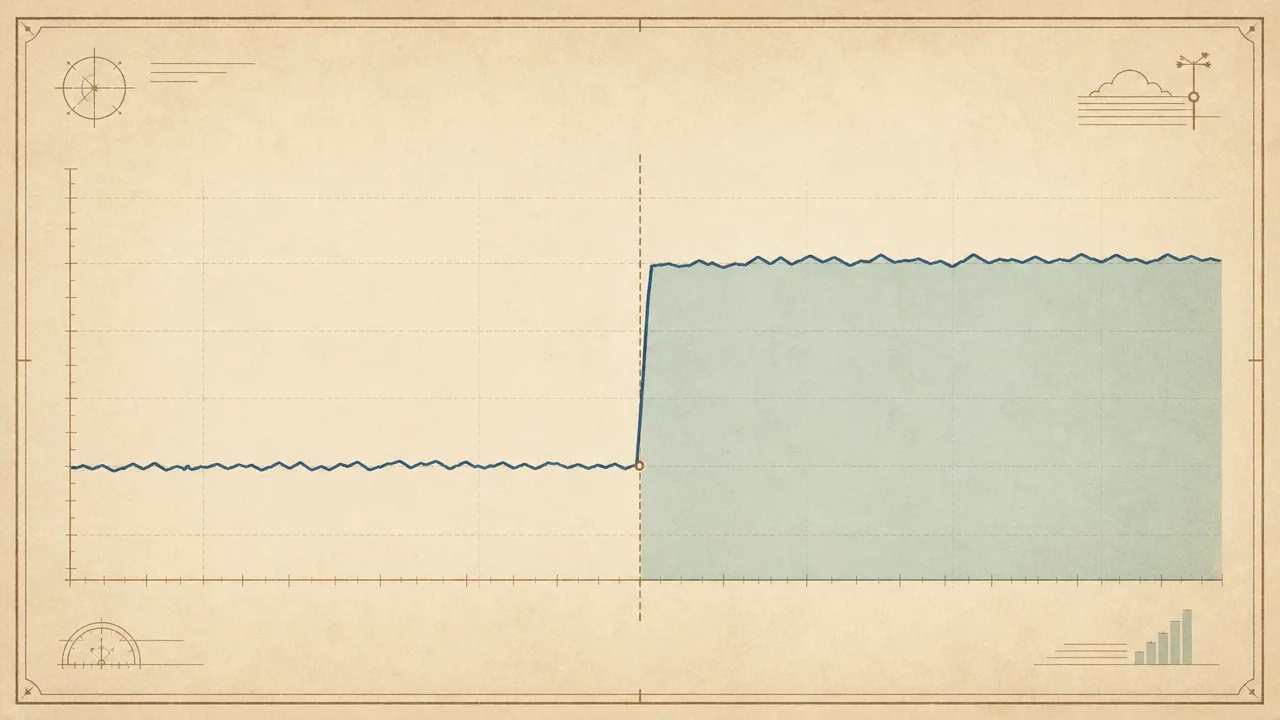
The final step is detecting regime shifts. These are points where the average level, the variance, or the composition of the series changes and stays changed. A new job, a switch from one editor to another, a move to a hybrid schedule, or adoption of a new communication platform all tend to produce visible breaks. Identifying them is partly statistical and partly contextual; the human knows what changed, the data confirms when and by how much.
Common benchmarks
Strict numerical benchmarks for activity trends are rare, because trends are by definition about change over time rather than about a target value. A few reference points from longitudinal research are nevertheless worth knowing, mostly as sanity checks for what your own series should plausibly look like.
- Computer activity is not flat across the working week. A 2023 PLOS ONE study using ergonomic monitoring software found that typing, mouse movement, mouse clicks, and scrolling all increase from Monday through Thursday and then drop noticeably on Friday, with afternoon activity falling further than morning activity.
- Knowledge-worker computer time has shifted later in the day in the post-pandemic period. Microsoft's 2025 Work Trend Index reports that meetings starting after 8pm are up about 16% year over year, and that the average employee now sends or receives more than 50 messages outside core business hours.
- Pandemic-era working hours initially rose sharply: NBER work documented increases of roughly 15-20% in working hours during the early lockdown period, before most countries trended back toward pre-pandemic levels later in 2020. The lasting change has been the distribution of hours across the day rather than the total.
- RescueTime's long-running aggregated user data suggests that roughly 40% of knowledge workers never get more than thirty consecutive minutes of focused computer time in a workday, a figure that has been stable across multiple years of their reporting.
- Weekend activity is real but small. RescueTime reporting has noted that close to 20% of employees who work on weekends are doing so before noon, often via email, suggesting a low-volume but persistent weekend baseline rather than a hard zero.
These are population-level patterns. Individual trends are far more variable, and the only fair comparison for a single person's trajectory is their own past.
Examples
A few worked scenarios show what trend analysis looks like in practice.
A senior engineer notices nothing unusual on any given day, but the twenty-eight day rolling average of focus time has been declining for three months straight while total active time has stayed flat. Application-level data shows time creeping out of the editor and into chat and email. Nothing in the daily totals would have surfaced the pattern. The trend view does, and it matches the kind of slow erosion that burnout-detection research describes as a leading signal: stable hours, shrinking deep work, growing communication load.
A team adopts a new code editor in February. The year-over-year view in October shows that average daily time in the editor is twenty percent higher than the previous October, while time in the old editor has fallen almost to zero. Total active time is unchanged. The regime shift is visible as a clean step in the application-mix series around the date the tool was introduced, exactly the kind of structural break that makes year-over-year comparisons informative rather than alarming.
A consultant takes a two-week vacation. The daily series shows a deep trough during the holiday and a sharp return in the first week back. The rolling average dips and then recovers within about three weeks. The year-over-year comparison, taken in the following spring, shows the same shape in the same calendar weeks and a return to the prior baseline, confirming that the vacation was a seasonal feature rather than the start of a downward trend.
Misconceptions
The most common misconception is treating a short-term spike as a trend. A heavy week followed by a quiet week is not evidence of anything. Trends are defined by what survives smoothing. If a movement disappears in a four-week rolling average, it was probably noise.
A related error is failing to account for seasonality. December is quieter than November in most working populations. Comparing a mid-December week to a mid-November week and declaring a decline is not analysis, it is a mismatch. Year-over-year comparisons or seasonally adjusted series exist precisely to avoid this.
The "January effect" is another reliable source of false trends. New tools, new resolutions, and new tracking setups often produce a brief surge of activity in early January that fades by mid-February. Reading the surge as a permanent change tends to disappoint by the time spring arrives. The honest comparison is January to January, not January to the rest of the year.
Finally, trends are not causes. A declining focus-time curve does not explain itself. It points to a question. The answer almost always comes from context that lives outside the data: a change of role, a new manager, a new app, a season of life, or simply a different definition of what counts as work.
Related concepts
Activity trends draw on, and feed into, a network of closely related metrics. Understanding them is mostly a matter of understanding which of those metrics you are watching over time.
- Usage analytics: the broader practice of analysing computer-usage data, of which trend analysis is one method.
- Usage distribution: how activity is spread across hours, days, or applications, which often shifts as a trend.
- Active time: the most common base metric for trend lines covering total engagement.
- Focus time: a trend that often moves independently of total active time and is a strong burnout signal.
- Application usage: the application-by-application breakdown whose composition shifts in regime changes.
- Productivity metrics: derived scores that ride on top of activity trends and inherit their pitfalls.
- Activity tracking: the data collection layer that produces the daily series in the first place.
- Workday fragmentation: a structural pattern whose long-term direction is itself a trend.
- Context switching: a behavioural metric that often trends upward when focus trends downward.
- Idle time: the complement of active time, whose seasonality is the easiest to misread.
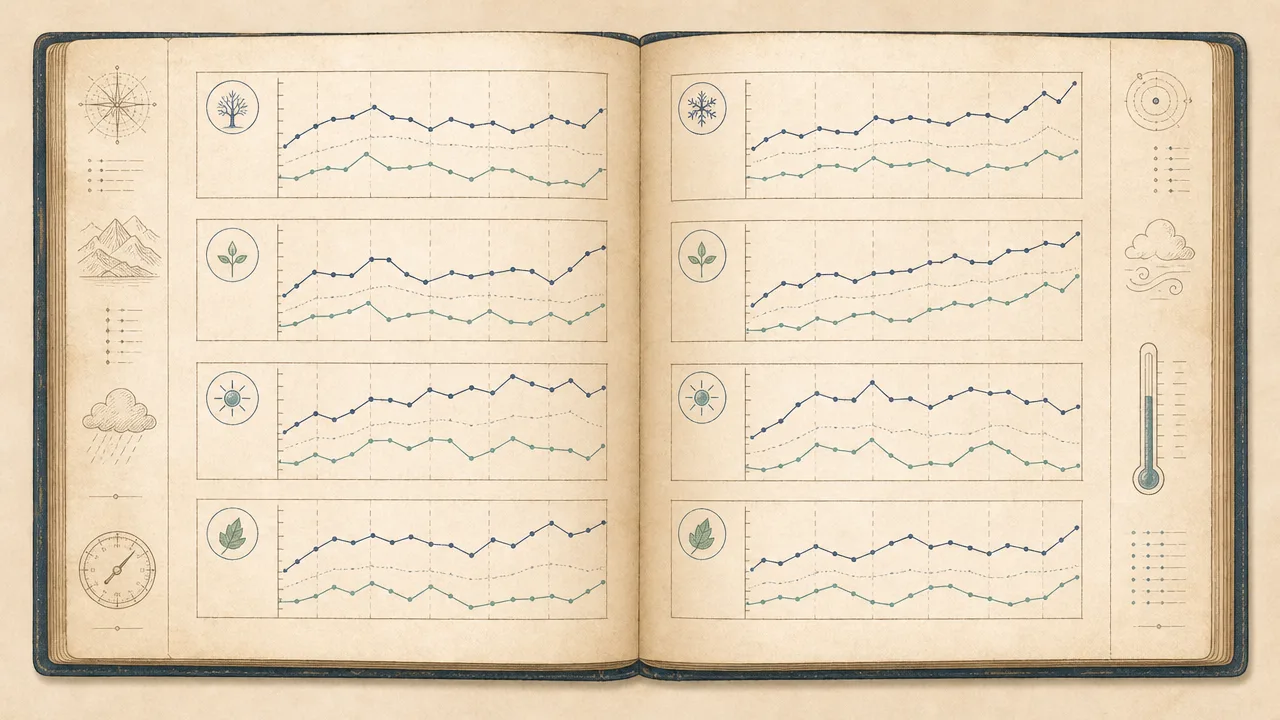
Tracking activity trends
Trends only become readable with a long history of consistent measurement. A single week of data has no trend. A single month has barely the beginnings of one. Anything genuinely useful starts at a few months and becomes meaningful at a year, by which point seasonality is visible and year-over-year comparison becomes possible. This is the main practical reason to start tracking activity sooner rather than later: today's data is next year's baseline, and you cannot retroactively measure last year.
WhatPulse is a personal computer-activity tracker designed for exactly this kind of long view. It runs locally on Windows, macOS, and Linux, records active time, keystrokes, mouse activity, application usage, and network use, and lets users inspect the resulting series on rolling-average and year-over-year views once enough history has accumulated. Because measurement happens on the device, the historical record is not dependent on staying signed in to any service, which matters for trend analysis over years.
The point of trend tracking is not to produce a score for the year. It is to give a stable, honest record of how habits have actually shifted, so that decisions about focus, tooling, and workload can be made against evidence rather than recent memory. Memory tends to remember the last two weeks. Trends remember everything.
Frequently asked questions
How long do I need to track before activity trends become meaningful?
A useful rolling average needs at least four to six weeks of data, and seasonal patterns only become readable after a full year. Year-over-year comparisons obviously require two years. Anything shorter is closer to a snapshot than a trend.
Is a sudden spike a trend?
No. A single high day or even a single high week is almost always noise. A trend is a directional shift that survives smoothing across many days, ideally one that persists when you remove the highest and lowest outliers.
What is the difference between a trend and seasonality?
A trend is a directional change over time. Seasonality is a repeating pattern, such as lower activity on weekends or in late December. Good trend analysis separates the two so that an expected dip is not mistaken for a decline.
Why does my activity drop every Friday?
Friday declines are well documented in computer-usage research. A 2023 PLOS ONE study using ergonomic monitoring software found typing volume, mouse movement, and clicks all decrease on Fridays compared with the Monday-to-Thursday baseline.
Can activity trends predict burnout?
They can flag risk patterns, not predict outcomes. Workforce analytics literature points to sustained overtime, eroding break patterns, and creeping evening activity as common precursors. None of these on their own confirm burnout, but a persistent combination is worth attention.
Do new tools always show up as a trend break?
Usually, yes. Adopting a new editor, switching browsers, or moving to a different communication platform tends to produce a regime shift in application-mix metrics within a week or two. Total active time often shifts less than the application breakdown does.
How should I compare this year to last year?
Compare like with like: the same weeks, the same days of the week, and the same seasonal context. A January-to-January comparison is more honest than comparing January this year to October last year.
Are trends comparable across different tracking tools?
Only loosely. Idle thresholds, activity grading, and category rules differ across tools, so the absolute numbers will not match. The shape of the trend usually does, which is why most analysts treat each tool as its own internally consistent timeline.
Conclusion
Activity trends are what daily computer-usage metrics become when you stop reading them one day at a time. They smooth out the noise, surface the predictable rhythms, expose the structural breaks, and put the current period in context against the same period last year. None of that is possible from a snapshot, and most of it becomes available almost automatically once a year of consistent data exists.
Treated carefully, with attention to seasonality, smoothing, and known regime shifts, trends are the part of personal analytics that actually changes minds. Treated carelessly, they are an excellent source of false confidence. The difference is mostly in how long the history is and how patiently it is read.