Using the Input tab
The WhatPulse Input tab enables you to monitor and analyze your keyboard, mouse, gamepad clicks, and other input history. Learn everything there is to know about your keyboard and mouse usage.
Keyboard:
This tab provides you with a comprehensive overview of your keyboard usage, including a heat map representation, detailed usage information, and the ability to view data over various time frames such as today, yesterday, the past week, month, six months, and so on. Additionally, you can export or share your keyboard usage data and view keyboard usage for specific applications on your computer. If desired, you can also reset your usage data.
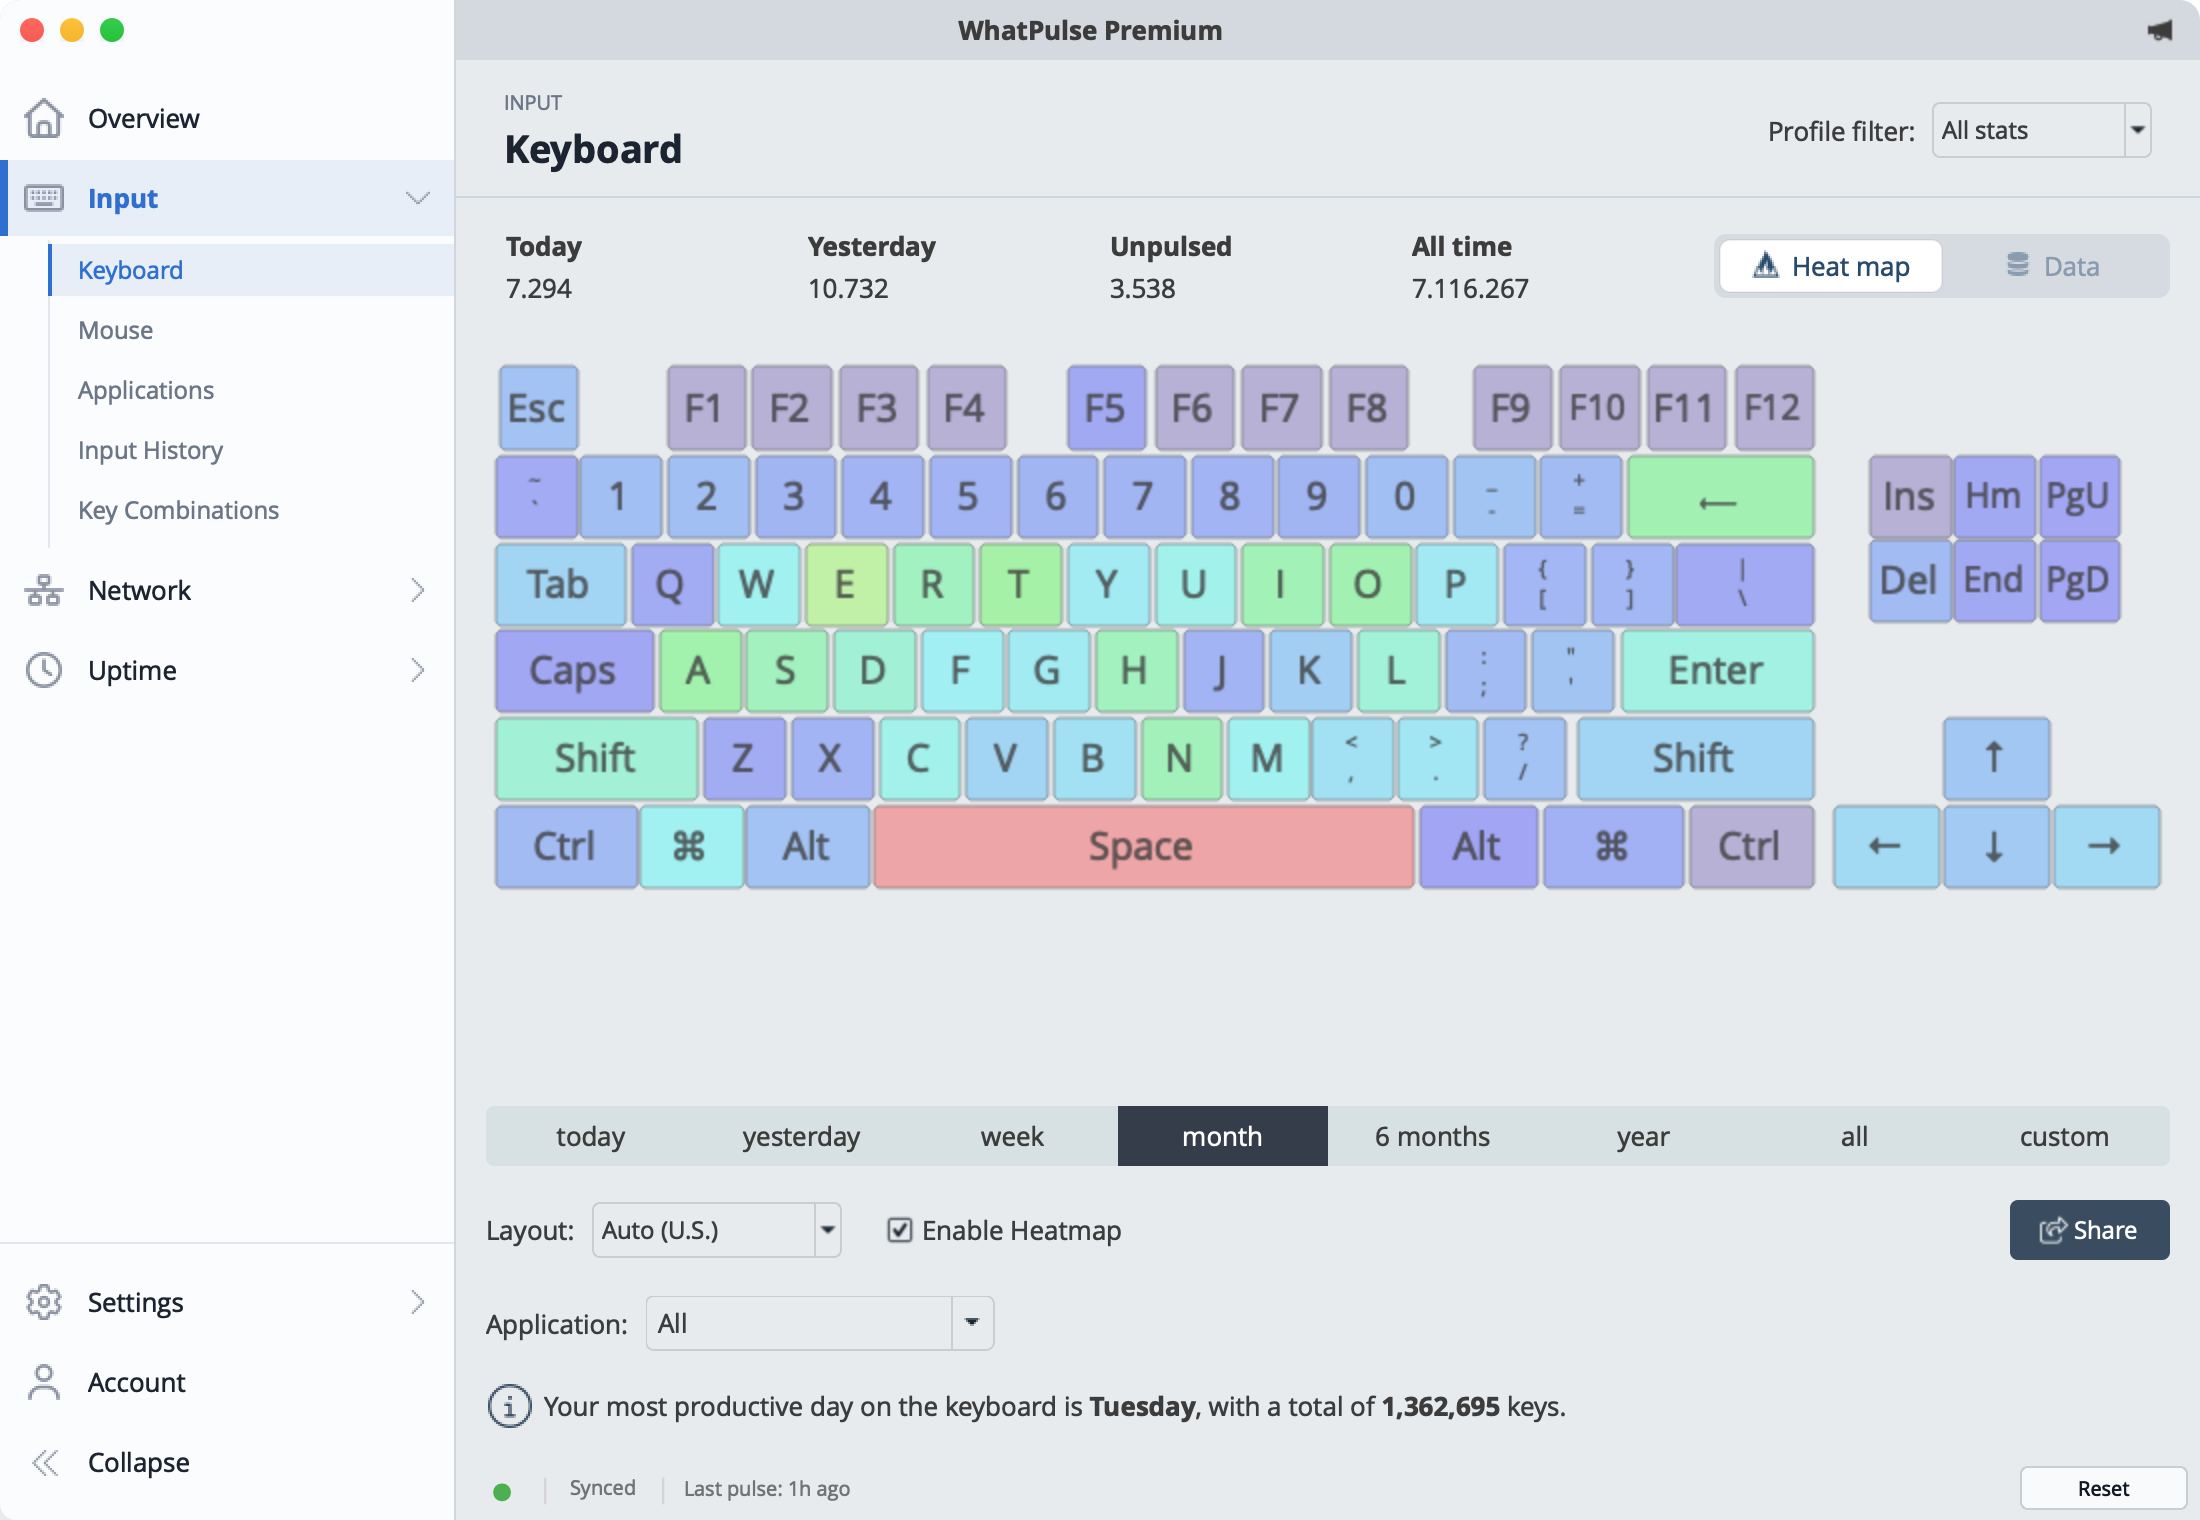
| Option | Description |
|---|---|
| Heat map | A graphical representation of your keyboard usage, with different colors indicating the frequency of use for each key. |
| Heat map / Data | The toggle at the top right switches between the keyboard heatmap and the per-key data table. |
| Layout selection | Allows you to select different types of keyboard layouts to display the heat map. |
| Enable heat map checkbox | A toggle to turn the data collection for the heat map on or off. |
| Export | The capability to export your keyboard usage data as a file. Learn about exporting |
| Share | The ability to share your keyboard usage data with others on your public profile. |
| Application selection | A menu to view keyboard usage data for specific applications on your computer. |
| Reset | The option to reset your keyboard usage data. |
| Timeline | The capability to view keyboard usage data for different time periods. |
| Profile filter | A filter to view keyboard usage data for specific profiles. |
Keyboard layouts
The Layout dropdown controls which keyboard layout the heatmap draws: Auto, QWERTY, QWERTZ, Dvorak, Colemak, or AZERTY. On Auto, WhatPulse detects your active layout and shows the detected name right in the dropdown.
Gamepad button clicks (A, B, L1, etc.) currently show up in the mouse details page. Open Input > Mouse and select Data at the top right to see gamepad buttons in the Button Clicks table.
Mouse
The Mouse tab provides insight into your mouse usage, including the number of clicks, scrolls, and distance traveled. A heatmap is available for click position visualization, and you have the option to view usage data for different time periods. Additionally, you can toggle the heatmap display and save or share mouse usage data.
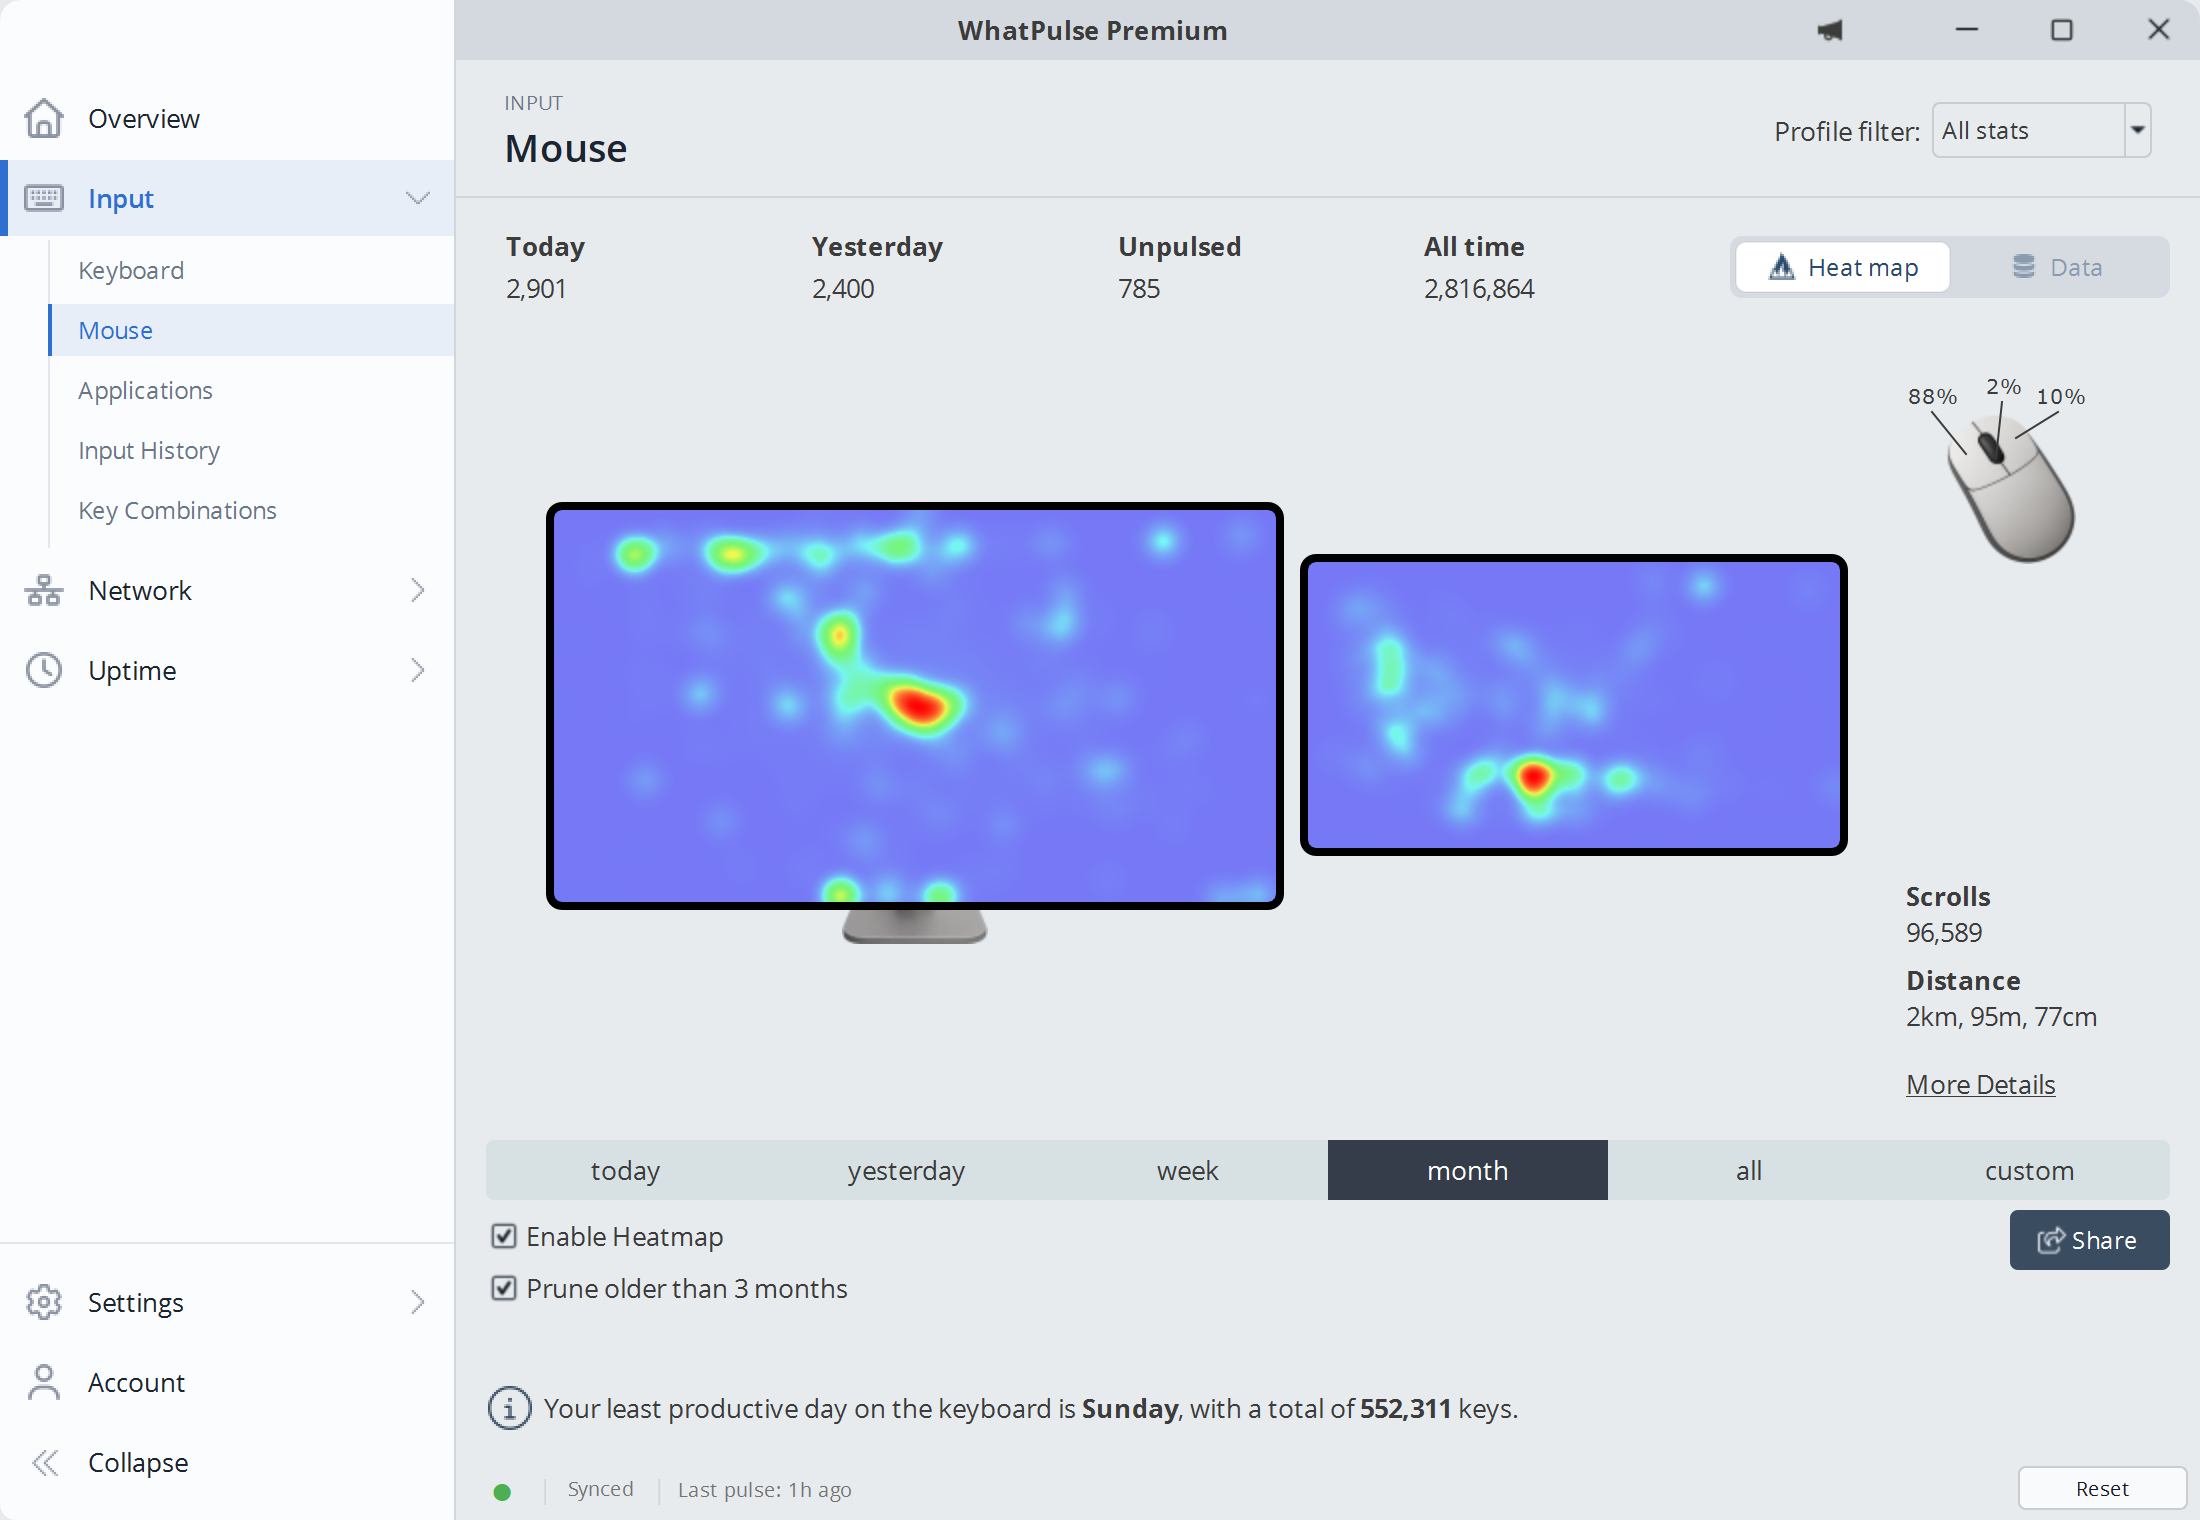
The following table outlines the various options and actions available in the Mouse tab:
| Option | Description |
|---|---|
| Heat Map | Displays a graphical representation of mouse click positions. If you have multiple monitors, you can click the monitor to zoom in to a specific monitor. |
| Heat map / Data | The toggle at the top right switches between the mouse heatmap and detailed click, scroll, and distance data. |
| Timeline | Displays mouse usage data for different time periods. |
| Scrolls and distance | Displays the scrolls and distance for the selected time period. Click More Details to learn more. |
| Export | Saves mouse usage data to a file. |
| Share | Shares mouse usage data with others on your public profile. |
| Reset | The option to reset your mouse usage data. |
| Enable heat map checkbox | Toggles the display of the heatmap on and off. |
| Prune older than 3 months | Removes data older than three months from mouse usage history. Enabling this helps speed up the heat map. |
| Profile filter | A filter to view mouse usage data for specific profiles. |
The monitor depiction in the heat map is based on the monitor layout you have currently on your computer. If you change it by moving monitors around, the heat map will update to reflect that change.
If you have multiple monitors, you can click on the monitor to zoom in to a specific monitor.
Applications
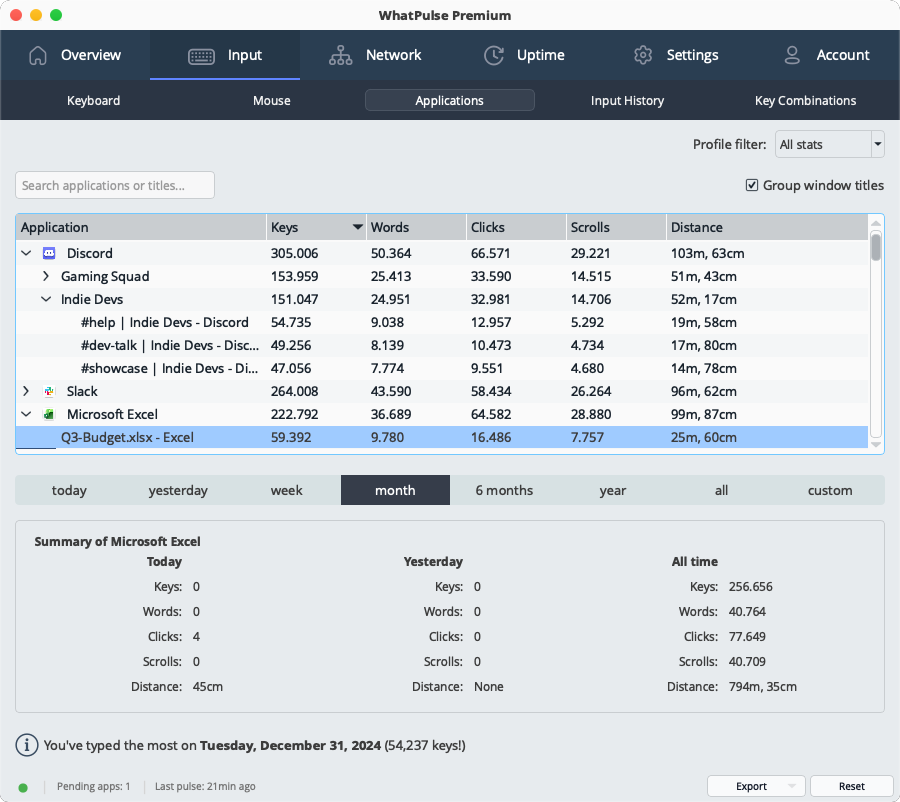
The Applications tab provides a comprehensive view of keyboard and mouse usage for all of your applications. Usage details, including keys pressed, words, clicks, scrolls, and distance traveled, are available for different time periods, such as daily, weekly, monthly, and more.
Since WhatPulse 6.3, you can expand any application to see its input broken down per window title: keys, words, clicks, scrolls, and distance for each document, site, or window. The search box finds a title across all your applications at once, and the Group window titles checkbox folds related titles into projects and workspaces. See Window title tracking for details.
Input History
The Input History sub-tab provides a graphical and tabular representation of your keyboard and mouse usage, including the time and date of each input. A chart view and table view are available, allowing for a visual and numerical understanding of your usage. You can switch between the graphical and tabular view by clicking the Chart view or Data view.
Key Combinations
Lastly, the Key Combinations sub-tab allows you to gain deeper insights into your keyboard usage patterns. By visualizing the most frequently used key combinations, you can identify areas for improvement and streamline your workflow. Additionally, the ability to hide key combinations with only the Ctrl or Shift keys provides further customization options, allowing you to focus on the key combinations that matter most to you.
You can also use the Hide Ctrl only and the Hide Shift only checkboxes to hide key combinations with Ctrl or Shift.
Conclusion
To summarize, the Input tab of WhatPulse provides a comprehensive suite of tools to track and analyze your keyboard, mouse, and input history. Whether you're looking to view detailed information about your keyboard and mouse usage, explore key combinations, or visualize your input history, the Input tab has you covered.
Per-Application statistics and the Input History are Premium features.