
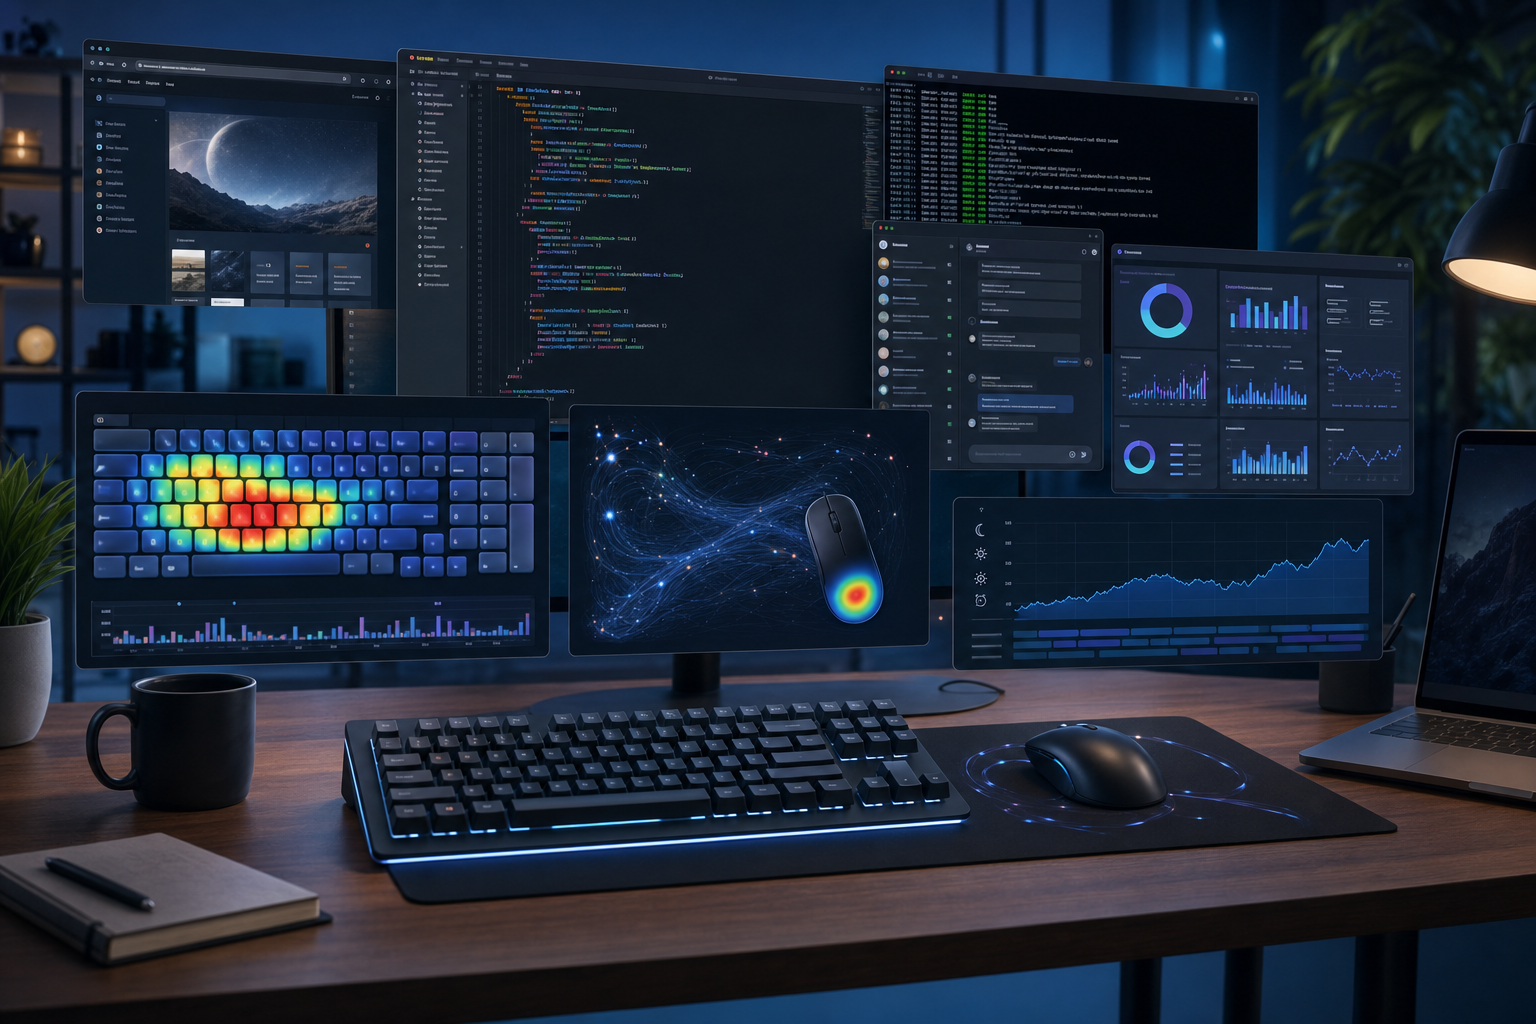
Developers usually spend their time across a few repeating modes: editor work, browser research, terminal bursts, communication, and the occasional build or review cycle. The useful question is not how many hours sat in a chair. It is which computer activities filled those hours, and whether the mix matched the job you thought you were doing.
If you want the short answer, a developer computer day usually shows up as a mix of application usage, website visits, keyboard activity, mouse activity, and uptime. That combination tells you whether you were building, debugging, reading, reviewing, coordinating, or just leaving the machine awake while life happened elsewhere.
What developer computer usage statistics actually show
Developer computer usage statistics are useful because they reveal work mode, not just work time. A feature day and a bug fix day have different fingerprints. A review day looks different from a release day. A meeting heavy day looks different from a deep build day. Once you measure the right signals, those differences stop being guesses.
The editor often leads, but it rarely tells the whole story. The browser pulls in documentation, issue trackers, API references, package docs, and search results. The terminal appears in bursts when you run tests, launch local services, or inspect logs. Chat and ticket tools create interruptions. Build systems and container tools add their own rhythm. If you only count total computer time, all of that gets flattened into one dull number.
WhatPulse gives you the layers you actually need. Start with the WhatPulse app, then use the stats dashboard for the overview. From there, the application stats, website stats, and uptime stats pages let you split the day into pieces that make sense.
The pattern you see is usually the truth you already suspected. It just comes with receipts.
The five signals that matter most
Use the smallest useful set of signals.
- Applications, to see where the time went.
- Websites, to see where the browser attention went.
- Keyboard activity, to see when you were actively creating.
- Mouse activity, to see when you were navigating, reviewing, or gaming.
- Uptime, to see whether the computer was busy or merely available.
Those signals answer different questions. Application time shows tool choice. Website time shows attention drift and research. Keyboard counts point toward writing, coding, and editing. Mouse counts point toward navigation, design work, or games. Uptime separates active sessions from an idle machine that stayed on while you made coffee, attended a meeting, or forgot the laptop was open on the desk.
Developers often underestimate the browser. The browser is where documentation, code search, tickets, tracebacks, and deploy dashboards all live. It can be the second workbench after the editor, or the first workbench during a rough week. That is why browsing patterns deserve the same respect as typing counts. The browser is where a lot of engineering work happens, even when it does not look elegant enough to brag about.
A decision table for reading the pattern
| Pattern | Likely work mode | What to check next |
|---|---|---|
| High editor time, high keyboard counts, moderate browser use | Focused implementation | Compare with commits, tickets, or release notes |
| High browser time, high mouse counts, low keyboard counts | Review, research, or fragmented switching | Check whether you were debugging, reading docs, or drifting |
| High terminal time, high network activity | Builds, deploys, package work, or container activity | Compare with logs, CI runs, and dependency changes |
| High uptime, low input | Meetings, idle time, downloads, or a machine left running | Separate active time from available time |
| High clicks and frequent app switching | Support, admin, or context switching | Look for repeated interruptions that can be batched |
The table is blunt on purpose. It forces meaning onto the numbers before you start telling yourself stories. A high number can mean deep work, shallow work, or a difficult interface. Context decides.
What changes across development work
Different kinds of development work leave different fingerprints.
Feature work usually shows a long editor block, a browser full of reference material, and bursts of terminal activity when you run tests or start the app again. Code review shifts the ratio toward browser and mouse activity, with fewer keyboard bursts and more time spent comparing changes. Debugging produces a messier pattern, because you jump between logs, browser dev tools, issue trackers, and the editor until one clue finally stops lying to you.
Meetings create another pattern entirely. Keyboard counts drop, browser and chat rise, and uptime can look busy without much input. If you only look at total time, that kind of day looks productive. If you compare it with keyboard and mouse activity, you can see that the machine was present while the work was somewhere else.
Gaming after work makes the pattern more obvious. Games often produce dense mouse and keyboard spikes, long active sessions, and a clear split between office hours and evening behavior. If you like data, that split is the point. It shows that your computer is not one habit. It is several habits sharing a desk.
Why application usage beats vague productivity labels
A developer can spend three hours in a browser and have done real work. Another developer can spend the same three hours in a browser and have collected half the internet. Application usage is more useful than a productivity label because it shows the actual tool mix.
A browser session can mean documentation, code search, tickets, tutorials, or distraction. A terminal session can mean deployment, package work, logs, or a long argument with a shell script. A chat app can mean coordination or interruption. A design tool can mean engineering support or visual tinkering. The app name alone is only half the story, but it is still better than guessing.
If you want to understand your own week, look for repeated combinations:
- editor plus browser,
- terminal plus network activity,
- chat plus low keyboard counts,
- browser plus mouse heavy review,
- uptime plus almost no input.
Those combinations describe work better than a vague label ever will. They also give you something you can change. If browser switching is the problem, reduce tab churn. If terminal work clusters around build failures, improve local feedback. If chat breaks the day into pieces, batch messages and notifications. The fix should match the pattern, otherwise you are just polishing a symptom.
Input data helps separate creating from consuming
Keyboard and mouse data give the most value when you treat them as context, not grades. High keyboard counts often mean writing, coding, editing, or heavy note taking. High mouse counts often mean navigation, UI work, or games. Neither signal tells you whether the day was good. They only tell you what kind of activity happened.
That distinction matters because developers spend a lot of time consuming information in order to create something else. Reading docs, checking diffs, scanning logs, and inspecting issue threads all count as work. They may even be the most important work on a hard day. The data helps you see that the day was not empty just because the keystroke count was lower than usual.
A weekly review that takes ten minutes
A developer does not need a large ritual to get value from this data. A ten minute review is enough.
Checklist:
- Open your WhatPulse stats dashboard.
- Check the top applications for the week.
- Check the top websites for the same period.
- Compare keyboard and mouse activity with the previous week.
- Look for one high uptime day that did not match your memory of the day.
- Write one sentence about what changed.
- Pick one adjustment for next week.
That is the full loop. The point is to find one useful pattern, not to produce a miniature government report on your own desk.
If you want a more focused starting point, the older posts on computer usage tracking and website usage tracking show the same measurement logic from different angles. The recent note on whether WhatPulse is safe is worth reading too if privacy is the first thing you check before installing any tracker.
What to do when the numbers surprise you
Surprises are the useful part of tracking.
If browser time is higher than expected, ask whether documentation, support, or tab drift caused it. If keyboard counts are lower than expected, ask whether you spent the day thinking, reviewing, or in meetings. If mouse counts are unusually high, check for repetitive navigation, design work, or gaming. If uptime is long but input is low, separate availability from activity.
The next step should be small. Change one habit for one week. Use one browser profile for work and one for personal research. Put a recurring task into a planned block. Add a keyboard shortcut to a repetitive workflow. Close a noisy app before the day starts. Compare the next week against the previous one and keep the change only if the numbers and your experience both support it.
That is where self measurement becomes practical. You are not trying to be more efficient in the abstract. You are trying to make your computer day easier to explain, easier to compare, and easier to repeat when it actually works.
Developer activity is measurable because it is repetitive
Development work looks varied from the inside, but the computer sees repetitions. Same editor, same repo, same docs, same build failures, same tabs, same chat channels, same patterns of clicking and typing. That repetition is exactly why a tracker helps. It turns a fuzzy week into something you can inspect.
The useful question is simple. Which part of the day actually consumed the time? Once you know that, you can compare coding with reviewing, browsing with building, meeting time with input time, and work time with the machine being merely awake. That comparison is where the insight lives.
If you want to start today, use the WhatPulse app, skim the help center, and open the application stats and website stats pages for one week. After that, the numbers will already be better than memory. Memory has hobbies. Data has receipts.