Using the Overview Page
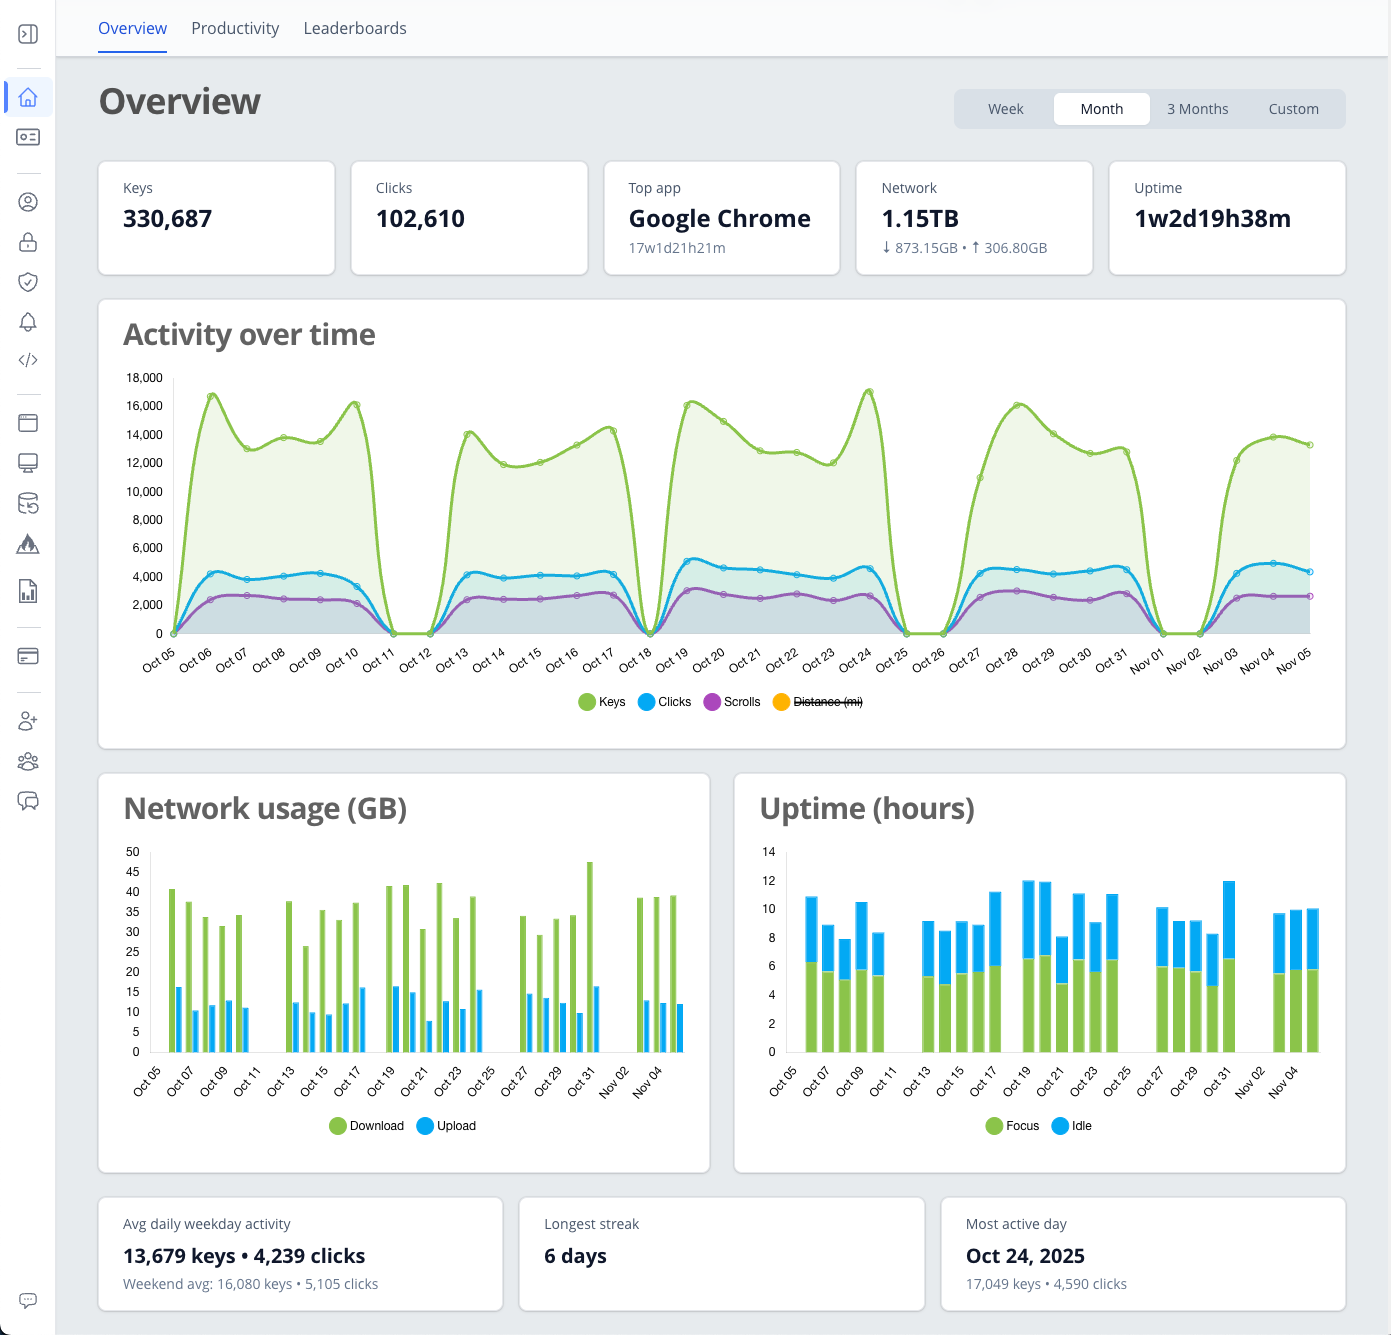
The Overview Dashboard shows a summary of your activity across all your computers. It’s the best place to see your daily or weekly trends for keys, clicks, uptime, and network traffic.
Sections
- Activity Chart: see your total keys, clicks, and pulses over time.
- Uptime: view how long your computer has been active or idle.
- Network Usage: track uploads and downloads to understand bandwidth use.
Each section updates automatically as new data is pulsed from your computers.
Expanding a chart
You can expand any chart by clicking the expand icon in the top-right corner of that section. The expand icon appears when you hover your mouse over the chart area.
When expanded, the chart takes up more space for easier viewing. Your choice is remembered between sessions, so your preferred layout stays the same next time you visit.
Date range
Premium members can choose from week, month, 3 months, or custom date ranges. Free members see data for the last week.