Profile statistics reports
There are two places where you can find statistics and reports about your profiles: the WhatPulse Dashboard and WhatPulse software. The software will show local stats for the computer it's running on, and the dashboard has all your profiles and stats so you can correlate between multiple computers.
Software
All pages inside the software, with a few exceptions (real-time network chart, reboot calendar), have a profile filter on the top right corner. You can select any profile here and the page will refresh with data from only the selected profile.
- Open the WhatPulse app on the page you'd like to filter on your profile, for example the Keyboard Heat map page.
- From the top right dropdown labeled as Profile:, select the profile you'd like to filter on.
- The data instantly refreshes to show only the selected profiles' stats.
Video length: 1min 1sec
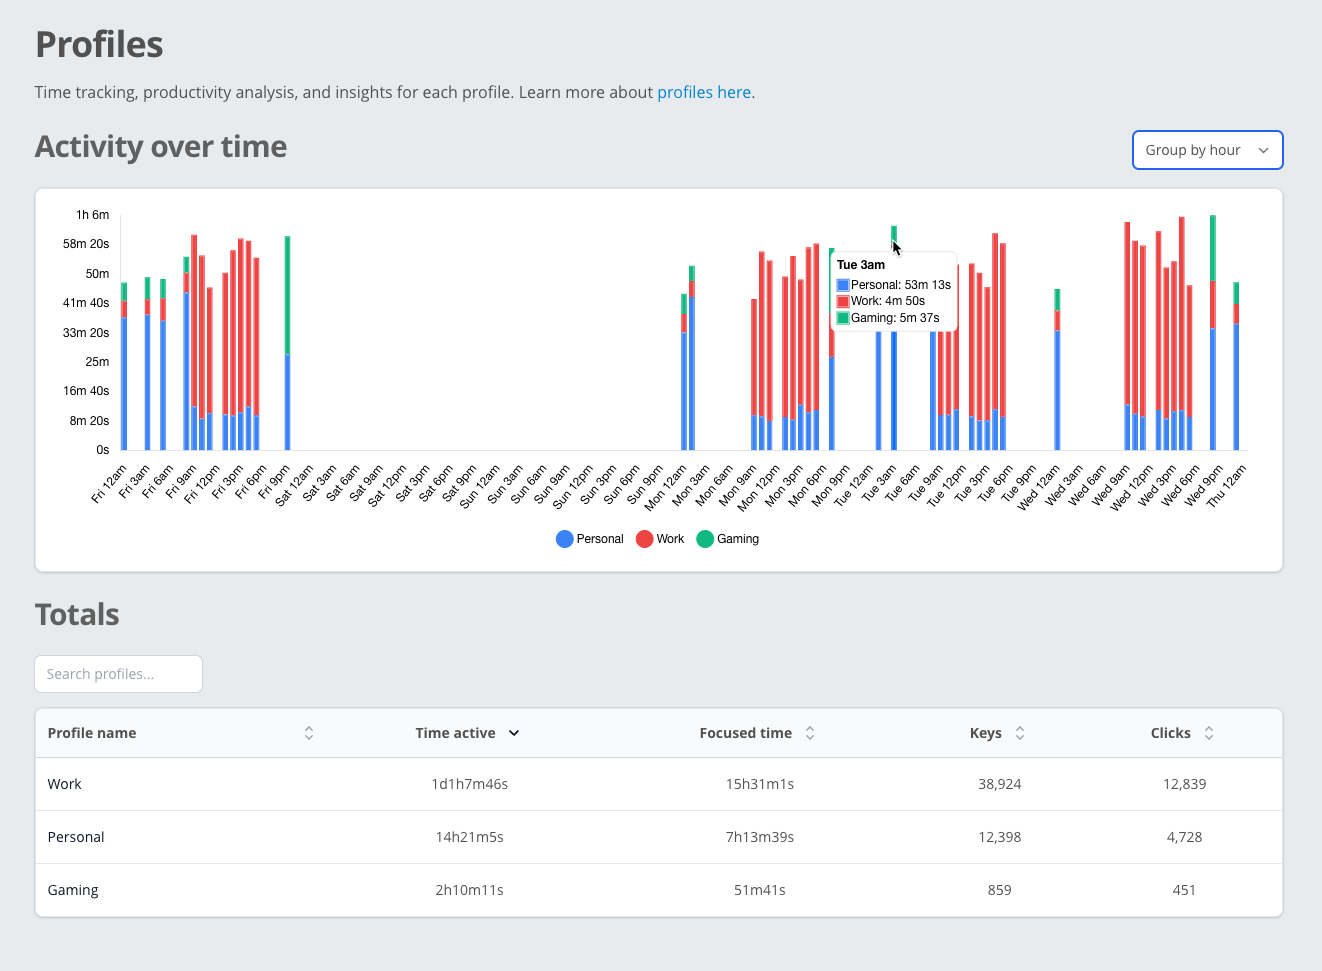
Website Dashboard
Your profiles and their statistics are centrally gathered on the website, in your private dashboard. It is here where you can view the accumulatives for a specified time period, like the last week, the last two weeks, the last month, the last 3 months, or a custom date range.
- Go to the WhatPulse Dashboard and log in if you haven't already.
- Navigate to the Productivity page using the left sidebar.
- Scroll down to the Time tracking profiles section.
- Here you can see an overview of your profiles, including active time spent in each profile.
- Use the date range selector at the top right of the page to choose the time period you want to analyze.