25 posts tagged with "content"

View All Tags

· 9 min read
Martijn Smit

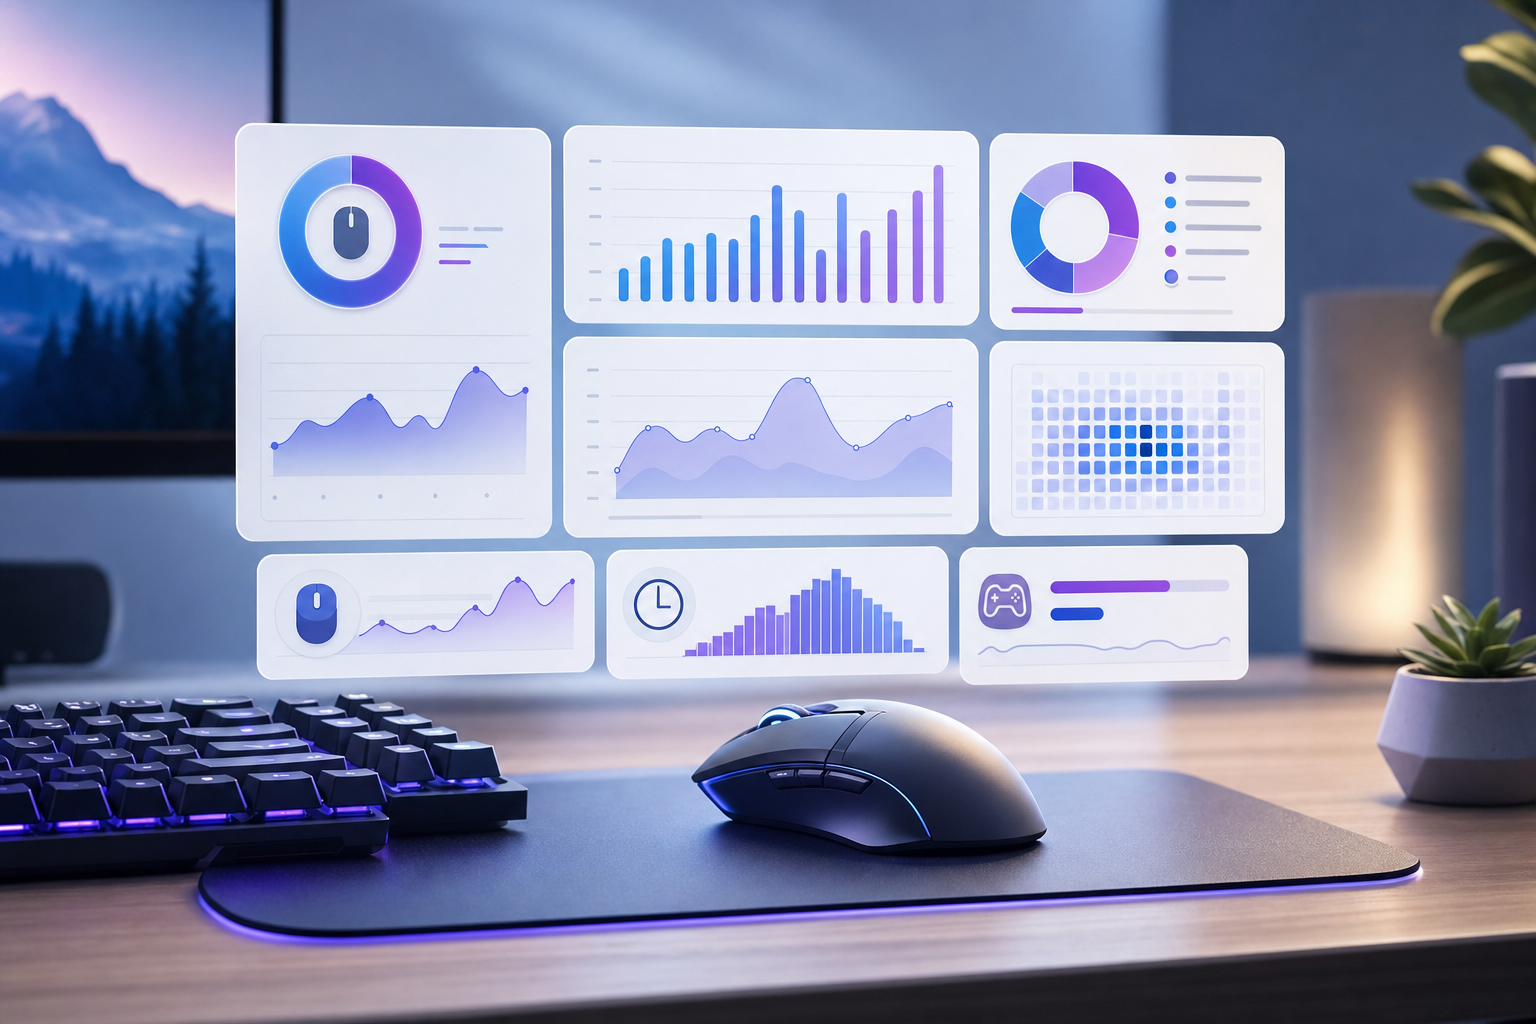
Dashboard style illustration of mouse click statistics and daily computer activity

Mouse click statistics show how often your computer activity depends on pointing, selecting, dragging, gaming, browsing, and switching between tasks. The useful number is not a universal average. It is your own baseline: clicks per day, clicks per hour, click bursts, scroll patterns, and how those numbers change across workdays, weekends, games, and applications.

A click counter becomes useful when you compare like with like. A design day, a spreadsheet day, and a strategy day create different input patterns. WhatPulse users can pair mouse activity with keyboard, application, website, uptime, and network stats to turn a vague feeling about computer use into a measurable record.

Why mouse click statistics are personal​

Most people want one neat answer to the question, “How many mouse clicks per day is normal?” That answer has a short shelf life. A developer reviewing pull requests, a gamer playing an FPS, and a remote worker moving between chat, documents, and dashboards may all spend six hours at a computer while producing completely different click totals.

Mouse click statistics depend on five variables:

  • Device setup: mouse, trackpad, tablet, keyboard shortcuts, and multi-monitor layout.
  • Work type: writing, coding, design, support, spreadsheets, browsing, gaming, or admin.
  • Software design: some tools reward shortcuts; others force repeated pointing.
  • Session rhythm: one long focused session looks different from 40 short context switches.
  • Personal habits: some people click through every decision; others search, type, and shortcut their way around.

That is why a personal baseline matters more than a public benchmark. A month of your own click data can answer better questions: Which days are unusually click-heavy? Which applications create repetitive input? Do gaming nights change next morning activity? Does a new keyboard shortcut habit show up in the numbers?

What to track beyond total clicks​

Total clicks are the headline number, but they hide the pattern. A day with 8,000 clicks spread evenly over eight hours feels different from 8,000 clicks packed into two frantic blocks.

Track these mouse activity metrics together:

MetricWhat it showsUseful comparison
Clicks per dayOverall mouse input volumeWeekdays vs weekends
Clicks per active hourIntensity while actually using the computerMeeting days vs production days
Click burstsRepetitive or high tempo activityGames, spreadsheets, admin tools
Scrolls and distanceReading, browsing, document review, map useResearch days vs creation days
Application contextWhere input happensBrowser, editor, game, chat, design app
Website contextAttention and browsing patternsLearning sites vs social feeds
UptimeHow long the computer was availableLong idle days vs active days

A table like this keeps mouse click statistics grounded. It also prevents a common mistake: treating high activity as automatically good or bad. High click counts can mean a productive design session, a long gaming night, repetitive admin work, or a poorly designed workflow. The context decides.

Mouse clicks, keyboard use, and computer habits​

Mouse activity rarely tells the full story alone. Pairing it with keyboard data gives the clearest view of computer behavior.

A writing day often has high keystrokes and moderate clicks. A design day may have more pointer movement, scrolls, and short click bursts. A code review day might show moderate keys, frequent clicks, and lots of browser or editor switching. A gaming session can produce dense input spikes that look unlike ordinary work.

The WhatPulse stats page shows how input activity can become a long-term record instead of a one-day curiosity. Inside the WhatPulse app, users can track their own activity across computers and compare patterns over time. If you are new to the idea, the WhatPulse help center explains the product basics and account setup.

You can also compare click data with related habits. The recent guide to using a computer usage tracker covers the broader view across apps, websites, input, uptime, and network activity. The guide to using a website usage tracker focuses on browsing patterns and attention.

How to build a useful click baseline​

A useful baseline needs enough time to absorb normal variation. One day can be noisy. Two weeks starts to show patterns. A month is better for comparing weekdays, weekends, games, and project cycles.

Use this simple process:

  1. Track normally for 14 to 30 days. Avoid changing behavior during the first measurement period.
  2. Separate workdays, weekends, and gaming days. Mixed averages blur the signal.
  3. Compare clicks per active hour, not only total clicks per calendar day.
  4. Add application and website context where available. Input without context creates guesswork.
  5. Mark unusual events: travel, hardware changes, new games, deadlines, outages, or long meetings.
  6. Review outliers manually. The weird days usually teach more than the average days.
  7. Pick one change to test. Try shortcuts, reduce tab switching, adjust mouse sensitivity, or reorganize a repetitive workflow.
  8. Compare the next two weeks against the baseline.

This approach treats mouse click statistics as evidence, not a scoreboard. The goal is to understand the work pattern underneath the number.

What high or low click days can mean​

A high click day can have several explanations. It might mean you spent time in a game, edited images, handled many support tickets, cleaned up files, or bounced through websites. It can also reveal friction: repeated navigation, awkward software, too many tabs, or a task that forces constant selection.

A low click day can also mean several things. Maybe you wrote, coded, attended meetings, listened to lectures, or left the computer idle. Low activity can signal focus, but it can also signal downtime. Again, context saves the analysis from becoming folk science with a nicer chart.

Operating systems and browsers process pointer events in structured ways. Microsoft documents how Windows handles input across devices in its keyboard and mouse input documentation, while the W3C publishes the Pointer Events specification for web interactions across mouse, pen, and touch input. These standards explain why modern input data can cover many devices and interaction styles, even when the habit you notice is simply “I clicked a lot today.”

Where ergonomics fits into click tracking​

Mouse click statistics can also support basic ergonomics awareness. They cannot diagnose strain, but they can reveal repetitive activity patterns worth noticing.

The OSHA computer workstation guidance recommends arranging input devices so wrists and arms stay in comfortable positions. The Canadian Centre for Occupational Health and Safety gives practical guidance for mouse placement and reducing strain. If your data shows long blocks of dense clicking, it may be a useful prompt to review setup, breaks, sensitivity, and shortcut use.

Treat the data as a cue. If a specific application produces heavy repetitive clicking every day, look for shortcuts, templates, macros, or interface settings. If gaming sessions produce high activity, compare session length, breaks, and next-day computer behavior. If admin work creates dense click bursts, the process may deserve automation. Yes, the spreadsheet might be the villain, but the data should testify first.

Gaming click patterns look different​

Gaming deserves its own interpretation. A click-heavy game can dwarf ordinary desktop activity. FPS, RTS, MMO, ARPG, and rhythm games all create different input signatures. Even within the same game, menus, combat, inventory management, and downtime can produce distinct patterns.

For gamers, mouse click statistics are useful because they turn sessions into history. You can compare weekdays against weekends, casual sessions against competitive sessions, or a new game against an old favorite. Pairing click counts with uptime and application activity makes the record more meaningful than hours played alone.

This is where WhatPulse-style tracking has a natural fit. Gamers already understand performance, sessions, and streaks. Clicks, keys, mouse distance, and uptime add another layer: not just what you played, but how your setup and habits changed over time.

A practical checklist for reviewing your data​

Use this checklist once a week or once a month:

  • What was my average click count per active hour?
  • Which day had the highest click count, and what was I doing?
  • Which application or website appeared during the click-heavy periods?
  • Did high click activity align with work, gaming, browsing, or admin tasks?
  • Did any input pattern change after a new tool, game, mouse, monitor, or shortcut habit?
  • Are there repetitive click bursts I could reduce with shortcuts or automation?
  • Did long computer uptime actually include active input, or was the machine mostly idle?
  • Did weekends show different behavior than workdays?

The best review ends with one specific question for the next period. For example: “Do browser shortcuts reduce click-heavy tab switching?” or “Does moving chat off the second monitor reduce context switching?” Small experiments beat heroic dashboard staring. The chart will not be offended.

Privacy and interpretation​

Personal activity tracking works best when it stays personal and intentional. Mouse click statistics should help you understand your own computer habits, not create pressure to maximize activity.

Avoid ranking days by raw activity alone. A thoughtful planning day may have fewer clicks than a chaotic admin day. A healthy break may look like a drop in input. A meeting-heavy day may show low keyboard and mouse activity while still being a real workday.

The U.S. Bureau of Labor Statistics American Time Use Survey is a useful reminder that time-use data needs categories and context to become meaningful. Your computer activity data works the same way. The number starts the question; it does not finish the answer.

What to do with mouse click statistics​

Mouse click statistics are most useful when you treat them as a baseline for self-measurement. Track clicks, keys, scrolls, mouse distance, uptime, application use, and website activity together. Then compare similar days, look for outliers, and test one change at a time.

For some people, the useful discovery will be ergonomic: one tool creates more repetitive input than expected. For others, it will be attention-related: certain websites appear during click-heavy context switching. Gamers may find session patterns they never noticed. Developers may discover that review days and build days have completely different input signatures.

If you already use WhatPulse, open your stats and compare your last few weeks. If you are starting fresh, install the app, let the baseline form quietly, and revisit the data after two ordinary weeks. The first good insight usually comes from a day that looks strange enough to investigate.

· 10 min read
Martijn Smit

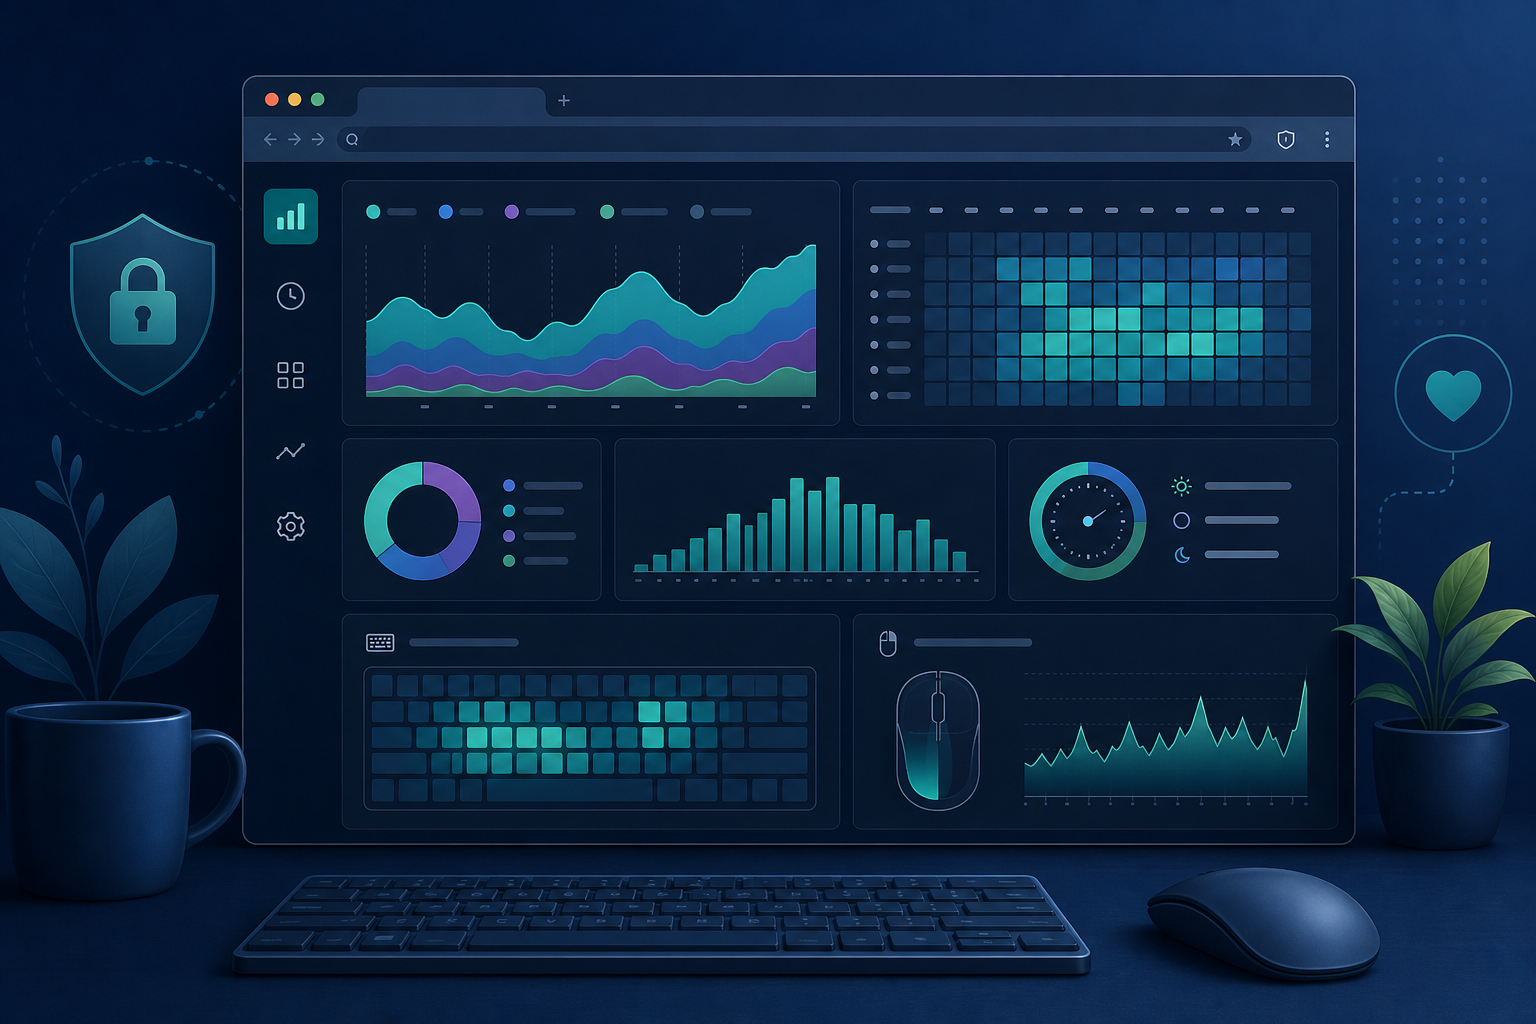
A calm desktop analytics dashboard showing website visits, time blocks, and browser activity patterns

A website usage tracker helps you see which sites pull your attention, when they appear in your day, and whether those visits match what you meant to do. The useful version is simple: measure websites, compare patterns, change one habit, then check the next week. You do not need moral labels for every domain or a minute by minute confession booth. You need enough evidence to answer practical questions like “Where did the afternoon go?” and “Which sites keep interrupting focused work?”

Website data gets useful when you treat it as activity context. A news site at lunch says something different from the same site opened twelve times during a coding block. A documentation site during a bug fix says something different from a shopping tab that keeps reappearing after every hard task.

The goal is to build a small measurement loop around browsing habits: collect website visits, group them by time and intent, choose one adjustment, and review the result later.

What a website usage tracker should tell you​

A good website usage tracker answers four questions without demanding a new hobby:

  1. Which websites show up most often?
  2. When do they appear during the day?
  3. How do those visits line up with keyboard, mouse, and application activity?
  4. Which pattern is worth changing first?

That fourth question matters most. Raw browsing history already exists in your browser. Chrome explains how to view and manage history in its Chrome history help, and Mozilla documents the same idea for Firefox in its guide to deleting browsing and search history. Those tools tell you what happened inside one browser.

A usage tracker becomes more useful when it connects the website list to the rest of your computer day. WhatPulse users can compare website activity with broader public and personal patterns through pages like WhatPulse website stats, application stats, and uptime stats. That combination helps separate casual browsing from repeated context switching.

The point is not to assign blame to a URL. The point is to make invisible patterns visible enough to act on.

Start with a one-week baseline​

Do not start by blocking half the internet. Start with a baseline week.

A week gives you five workdays, a weekend, and enough variation to avoid reacting to one strange Tuesday. During the baseline, avoid changing your setup. Keep your browser, applications, and work routine normal. If you change everything while measuring, you will learn that changing everything changes everything. Very useful, if your main research goal is circularity.

At the end of the week, look for these signals:

  • Top websites by visits or active time
  • Repeat visits during planned focus blocks
  • Sites that appear after meetings, deploys, support tickets, or long gaming sessions
  • Differences between weekday and weekend browsing
  • Domains that look necessary but may hide a lot of idle checking

Use the baseline to pick one measurable question. Examples:

  • “Do I open social sites more often after 3 p.m.?”
  • “Does documentation browsing happen in long research blocks or constant fragments?”
  • “Which entertainment sites appear during work hours?”
  • “Do I browse more on days with low keyboard activity?”

One question keeps the review useful. Ten questions turn the review into a spreadsheet swamp with browser tabs.

Use website data with keyboard, mouse, and app activity​

Website usage makes more sense when you read it beside other activity signals.

A website visit alone can mislead. A documentation tab might sit open while you work in an editor. A video page might be background audio. A project management site might be active work or avoidance with excellent branding. Keyboard and mouse activity help add context.

For example:

  • High keyboard activity plus documentation sites often points to active problem solving.
  • Low keyboard activity plus frequent social visits may point to passive checking.
  • High mouse activity plus dashboards may point to review work or admin tasks.
  • Uptime without input activity may mean the computer was on while you were away.

WhatPulse is useful here because it tracks computer activity over time, not just browser events. You can use the WhatPulse homepage as the product entry point, then compare browsing patterns with stats that show how your computer use changes across days. The WhatPulse help center is also a safer internal link than invented feature pages, which saves everyone from the quiet misery of 404 archaeology.

This combined view keeps the analysis grounded in behavior you can control. You are measuring applications, websites, input activity, network usage, and uptime signals. You are not trying to infer your entire personality from a domain list.

Decide what the pattern means before you change it​

A top website is not automatically a problem. Some sites are central to the work.

Use this decision table before making changes:

PatternLikely meaningUseful next step
High visits, high keyboard activity, mostly during planned workActive research or communicationLeave it alone; maybe bookmark repeated resources
High visits, low input activity, repeated across the dayPassive checking or background consumptionSet two planned check windows for one week
Short visits after difficult tasksRecovery habit or task avoidanceAdd a small break ritual before reopening work
Heavy weekend use, light weekday useLeisure patternTrack separately from workday attention
Long sessions on learning sitesTraining or deep researchCompare with notes, commits, tickets, or outputs
Many sites opened at once each morningStartup routine or tab clutterCreate a smaller launch set and review after a week

The table forces a decision before action. That prevents the common mistake of treating every high number as bad.

For example, a developer might see Stack Overflow, GitHub, documentation pages, and internal tools near the top. That can be normal work. The more useful question is whether those sites appear in concentrated research blocks or as scattered interruptions. A gamer might see forums, guides, Twitch, Discord, and patch notes. The useful question is whether those visits cluster around planned gaming time or leak into hours reserved for other tasks.

Build a small weekly review​

A weekly review should take ten minutes. If it takes an hour, you will stop doing it.

Use this checklist:

  • Pick one time window: work hours, evenings, or weekends.
  • List the top ten websites for that window.
  • Mark each site as work, learning, admin, communication, entertainment, or unclear.
  • Note the top two surprises.
  • Compare the pattern with keyboard, mouse, application, and uptime activity.
  • Choose one experiment for the next week.
  • Write down the expected change in one sentence.

Keep the labels loose. They exist to help you think, not to create a courtroom exhibit. A site can change meaning depending on the day. YouTube might be a tutorial, a music player, or a rabbit hole with thumbnails and consequences. Slack can be coordination or reflexive checking. GitHub can be deep work or issue grazing.

The review works best when you look for repeatable conditions. “I check news when I am tired” is more useful than “news is bad.” “I open forums after every failed build” is more useful than “forums wasted 47 minutes.” The first statement gives you a handle. The second gives you a number with a frown attached.

Make one change at a time​

A tracker should lead to small experiments. Pick one website pattern and change the environment around it.

Useful experiments include:

  • Move distracting bookmarks out of the bookmarks bar.
  • Keep one browser profile for work and another for personal browsing.
  • Create two planned check windows for social or news sites.
  • Close browser tabs at the end of each work block.
  • Replace a reflex visit with a short walk, note, or task list reset.
  • Use operating system focus settings during deep work blocks.

Apple documents its built-in activity controls in the macOS Screen Time guide. Browser and operating system tools can reduce exposure. WhatPulse-style tracking then helps you see whether the change affected your real day.

Measure the experiment for one week. Compare the same window from the baseline. Do not demand perfection. Look for direction:

  • Did repeat visits fall?
  • Did the distracting site move later in the day?
  • Did keyboard or app activity increase during the same block?
  • Did the change create a new distraction somewhere else?

That last question matters. Attention has a migration instinct. Block one site without understanding the pattern and another tab may volunteer for the job.

Keep privacy boundaries clear​

Website tracking becomes uncomfortable when people collect more than they need or use the data on someone else without consent.

For personal analytics, the clean rule is data minimization. Collect enough to answer your own question. Avoid collecting page contents, private messages, search text, or anything you would not want sitting in an exported file. The W3C describes privacy principles such as data minimization and user control in its Privacy Principles. Those ideas apply nicely to personal tracking too.

A healthy setup has boundaries:

  • Track your own computer activity, not another person’s browsing.
  • Review domains and time patterns before storing detailed page titles.
  • Avoid exporting raw browsing data unless you have a reason.
  • Delete old exports when the review is done.
  • Keep work, personal, and shared devices separate where possible.

If you manage a team, do not treat personal tracking methods as a quiet employee monitoring plan. Team analytics need explicit policies, consent, legal review, and cultural care. Personal website usage tracking works because the person being measured is also the person making the decision.

What to do with the result​

After two or three weeks, you should have a clearer picture of your browsing rhythm.

You might find that your biggest attention leak is not total time. It might be frequency. Opening a distracting site for two minutes, twenty times, can damage focus more than one planned forty-minute session after work. You might find that a site you assumed was wasteful is mostly attached to real work. You might find that your low-energy hour is predictable, which makes it easier to plan admin tasks instead of fighting biology with another coffee and a stern browser extension.

Use the result to adjust your environment:

  • Protect high-focus hours from repeated sites.
  • Move useful research into planned blocks.
  • Separate leisure browsing from work devices or profiles.
  • Watch for changes after holidays, job changes, releases, or new games.
  • Compare website patterns with application, input, network, and uptime stats.

A website usage tracker works when it helps you make one better decision about your day. The best outcome is not a perfect chart. It is a browsing routine that matches what you meant to do, backed by enough data to notice when it drifts.

· 10 min read
Martijn Smit

A computer usage tracker helps you see how your computer day actually works: which applications you use, which websites pull attention, how much you type and click, when the machine stays active, and where network activity spikes. The useful part is not a single score. The useful part is a repeatable baseline you can compare week after week.

If you want to track computer usage without turning your day into a spreadsheet ritual, start with five signals: applications, websites, keyboard activity, mouse activity, and uptime. Review them on a fixed schedule, make one small change, then compare the next period against the previous one. That is enough data to answer most practical questions without inventing a second job called “data janitor.”

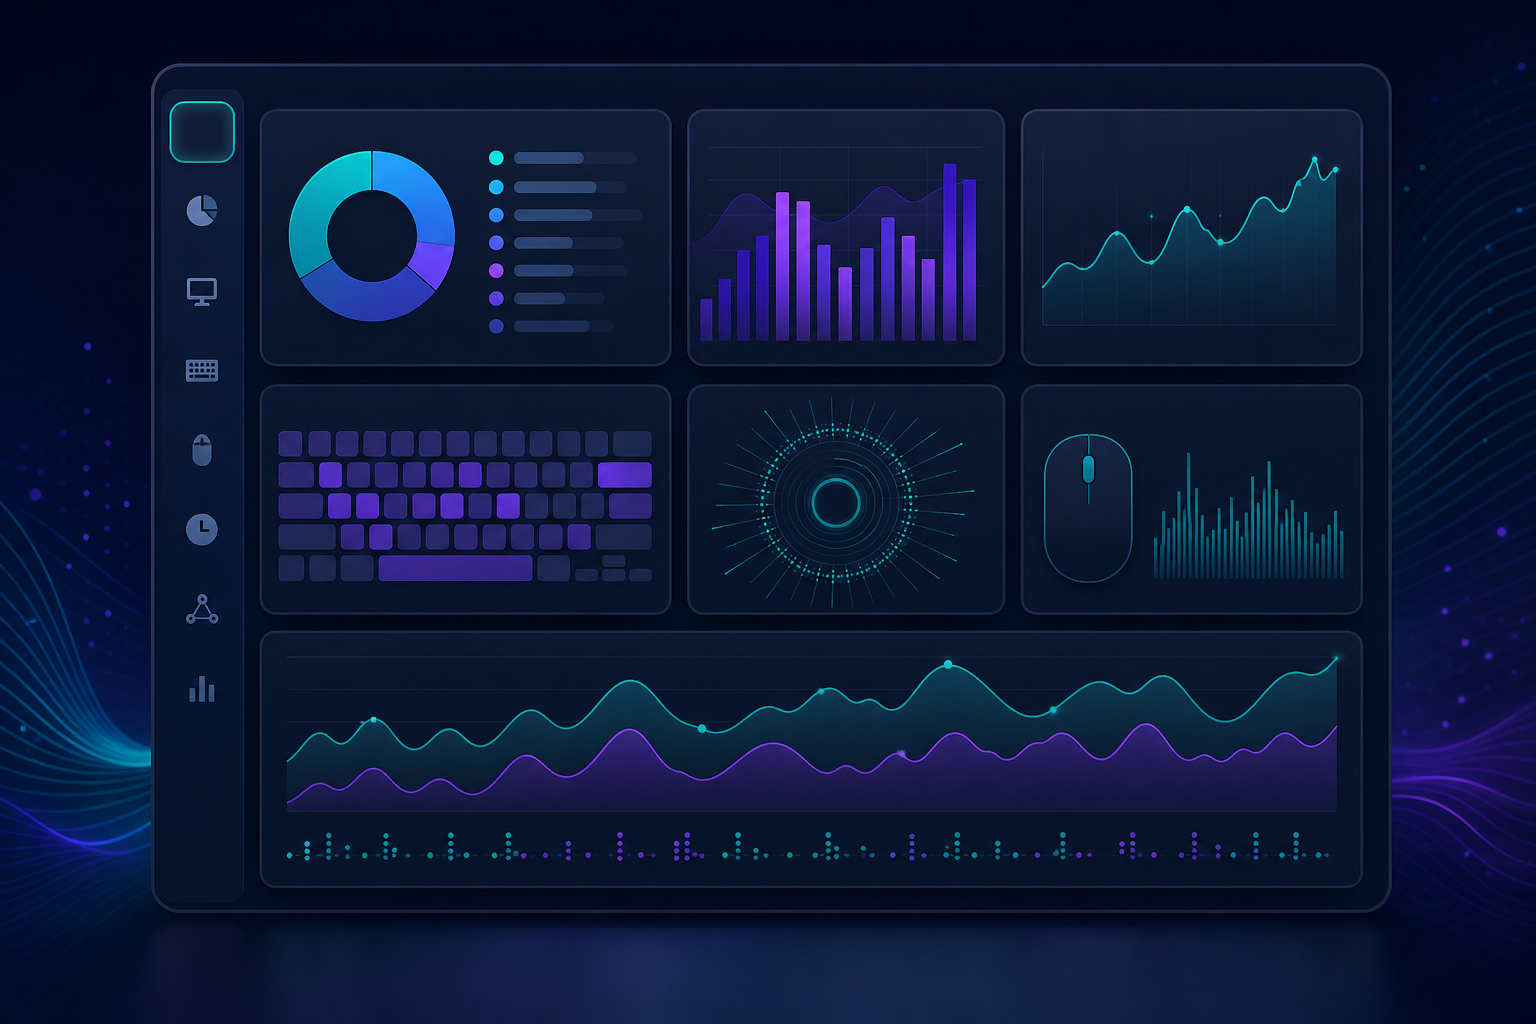
Abstract dashboard showing computer activity patterns across apps, websites, typing, mouse activity, uptime, and network usage

What a computer usage tracker should measure​

A useful computer usage tracker measures behavior that your computer can observe directly. That usually means active applications, window titles or websites, keyboard input counts, mouse clicks, scrolls, uptime, and network traffic. Those signals are concrete. They avoid the fuzzy question of whether a minute was “productive,” “distracting,” or “worth it.”

· 4 min read
Martijn Smit

Introduction​

Achieving peak productivity isn't just about time management and focus strategies. It also involves fueling your body with the right nutrients. Whether you're coding, gaming, or creating content, the foods you consume can significantly impact your cognitive abilities and productivity levels. In this comprehensive guide, we will dive into the science of brain nutrition and present a detailed list of foods that can help you maintain a sharp mind and sustain peak performance.

The science behind brain nutrition​

Understanding brain energy needs​

Your brain is an energy-intensive organ, using up to 20% of your body's calories. It demands a constant supply of glucose, delivered through a healthy diet, to function optimally. Additionally, it requires specific nutrients to maintain neural plasticity, ensure efficient neurotransmitter production, and protect against oxidative stress.

Key nutrients for cognitive health​

Omega-3 fatty acids​

Essential for maintaining the structure and function of brain cells, omega-3s, found in fatty fish like salmon, are critical for learning and memory. These fatty acids reduce neuroinflammation and support synaptic plasticity, enhancing overall brain health.

Antioxidants​

Foods rich in antioxidants, such as berries, nuts, and dark leafy greens, help fight free radicals that can damage brain cells. Blueberries, specifically, contain flavonoids that enhance brain function by improving communication between neurons.

B vitamins​

B vitamins, including B6, B12, and folic acid, are essential for brain health. They aid in the production of neurotransmitters, which are chemicals that facilitate communication between brain cells, thereby supporting mood regulation and cognitive function.

Minerals: Magnesium and Zinc​

Magnesium plays a critical role in brain cell signaling, while zinc is essential for nerve communication and brain development. Both minerals can be found in nuts, seeds, whole grains, and legumes.

Section Image

Foods to enhance brain performance​

Fatty fish​

Rich in omega-3 fatty acids, fatty fish like salmon, mackerel, and sardines are at the top of the list for brain health. Regular consumption supports cognitive function, improves memory, and may even slow age-related mental decline.

Berries​

Blueberries, strawberries, and blackberries are packed with antioxidants that protect the brain from oxidative stress. These fruits are linked to better memory and cognitive function due to their high flavonoid content.

Nuts and seeds​

Almonds, walnuts, and flaxseeds are excellent sources of healthy fats, antioxidants, and vitamin E. These nutrients protect brain cells from oxidative damage and promote healthy brain function.

Whole grains​

Whole grains like oatmeal, brown rice, and quinoa provide a steady supply of glucose, which is crucial for maintaining mental alertness and focus. Their low glycemic index ensures a gradual release of energy, preventing sugar crashes that can impair cognitive performance.

Dark chocolate​

Containing flavonoids, caffeine, and antioxidants, dark chocolate can enhance brain function by increasing blood flow to the brain. It also boosts dopamine production, improving mood and cognitive performance.

Avocados​

Avocados are rich in healthy fats that support brain health. They contain monounsaturated fats that promote healthy blood flow, essential for optimal brain function. They also provide vitamin K and folate, which help protect against cognitive decline.

Eggs​

A great source of several nutrients tied to brain health, including vitamins B6 and B12, folate, and choline, eggs help regulate mood and memory. Choline, in particular, is vital for the production of acetylcholine, a neurotransmitter involved in memory and learning.

Cruciferous vegetables​

Broccoli, kale, and spinach are full of antioxidants and vitamin K, which is believed to support brain health. These vegetables also contain glucosinolates, which can help reduce oxidative stress and inflammation.

How to incorporate these foods into your diet​

Meal planning tips​

Start by incorporating these brain-boosting foods into your regular meal plans. Swap out processed snacks for nuts and berries, and choose whole grain options over refined grains. You can add fatty fish to your weekly routine by trying a new salmon recipe or adding sardines to your salad.

Snack ideas​

Keep your energy levels steady with brain-friendly snacks. Try a handful of almonds with dark chocolate chips, or make a berry smoothie with spinach and avocado for a nutrient-packed snack.

Recipes for brain health​

Explore simple recipes that utilize these ingredients, like an avocado and egg breakfast toast, or a quinoa salad with spinach, walnuts, and blueberries. These meals not only taste great but also provide the essential nutrients your brain needs.

Conclusion​

Enhancing productivity through diet is a powerful yet often overlooked strategy. By incorporating brain-boosting foods into your meals, you can support cognitive function, improve memory, and maintain focus throughout the day. Just as WhatPulse helps you track and optimize your digital habits, understanding and adjusting your diet can provide significant gains in productivity. Start integrating these foods into your lifestyle and see the difference for yourself.

· 4 min read
Martijn Smit

At WhatPulse, we're all about productivity—measuring it, understanding it, and improving it. Raycast is one of those tools that fits right into our alley, offering a faster, more efficient way to navigate your Mac, run scripts, and interact with your favorite apps. Whether you're a power user or just getting started, here are some essential Raycast tips to boost your workflow.

1. Master the Command Bar​

Raycast's command bar is the heart of the app, replacing Spotlight with a more powerful alternative. It allows you to search files, launch apps, run scripts, and much more—all without touching the mouse.

  • Press ⌘ + Space (or your custom shortcut) to bring up Raycast.
  • Start typing to find apps, files, or commands instantly.
  • Use arrow keys to navigate and ↩ to execute.
  • ⌘ + K brings up a context menu for additional actions on the selected command.

command bar

Quicklinks let you open websites, files, or even deep links within apps with just a few keystrokes, saving time on repetitive navigation.

  • Open Raycast and search for "Quicklinks.”
  • Click "Create Quicklink” and define a name and URL (e.g., https://whatpulse.org/dashboard).
  • Assign a shortcut for instant access.

3. Supercharge Workflows with Extensions​

Raycast's extensions allow you to integrate with tools like Jira, GitHub, and Slack, bringing actions from your workflow into the command bar. There are more than 1900 extensions available in the Raycast Store, ranging from productivity tools to entertainment.

  • Open Raycast and go to "Store.”
  • Browse and install extensions relevant to your workflow.
  • Configure them in "Extensions” under Raycast settings.

Here are a few of our favorite extensions:

This is just the tip of the iceberg—explore the Raycast Store to find extensions that fit your workflow.

4. Automate Tasks with Scripts​

If you find yourself doing the same actions repeatedly, scripting in Raycast can help automate them, reducing friction and saving time.

  • Navigate to "Extensions” > "Create Script Command.”
  • Write a simple script in Bash, Python, or Node.js.
  • Assign a keyword or shortcut to trigger it instantly.

Here's an excellent step by step guide on how to create a script in Raycast: Getting started with script commands

scripts add hotkey

5. Manage Clipboard History​

Copying and pasting are frequent tasks, and losing previous clipboard entries can be frustrating. Raycast's clipboard manager stores your history for easy access.

  • Open Raycast and search for "Clipboard History.”
  • Browse recent items and paste them with a click.
  • Enable history in Raycast settings if it's not active.

6. Quick Calendar Access​

Jumping between your calendar and other apps can be disruptive. Raycast lets you check your schedule instantly.

  • Install the Calendar extension from the Store.
  • Open Raycast and type "My Schedule” to view upcoming events.
  • Create events without opening your calendar app.

calendar

7. AI Integration for Instant Answers​

Raycast Pro brings AI-powered productivity tools directly to your fingertips. With access to ChatGPT, Mistral, Perplexity, Meta Llama, and Anthropic Claude, you can chat with AI models, get answers instantly, and even create AI-powered automation commands to streamline repetitive tasks.

  • Open Raycast and search for "AI Chat" to start a conversation with your preferred AI model.
  • Use the automation assistant to create AI-driven commands that help with summarization, translation, or other repetitive tasks.
  • Customize AI settings in Raycast preferences to select your preferred model and fine-tune interactions.

Note: AI features are available in Raycast Pro, a subscription-based service that also adds additional features like custom themes, cloud sync, and more.

ai access

Final Thoughts​

Raycast is a powerhouse for productivity, bringing everything you need to your fingertips. Whether you're searching, automating, or organizing, these tips will help you get the most out of it. If you're a WhatPulse user, tracking how Raycast impacts your efficiency can be an interesting experiment—after all, productivity is what we're all about!