Using the Uptime tab
The WhatPulse Input tab enables you to monitor and analyze statistics about the uptime of your computer, including reboot history of your computer, details about your application usage and activities. Here's what you need to know:
Computer uptime
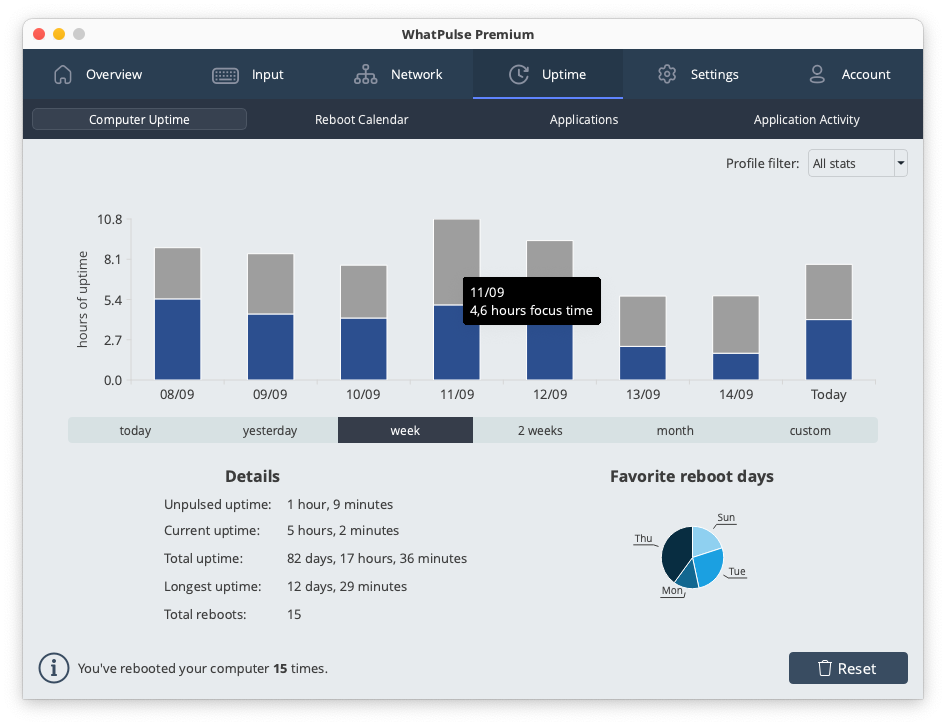
First up is the Computer Uptime tab. It gives you a comprehensive view of your uptime history, with graphical charts that show how much time your computer has spent up and running, as well as how many times it's been rebooted.

Reboot calendar
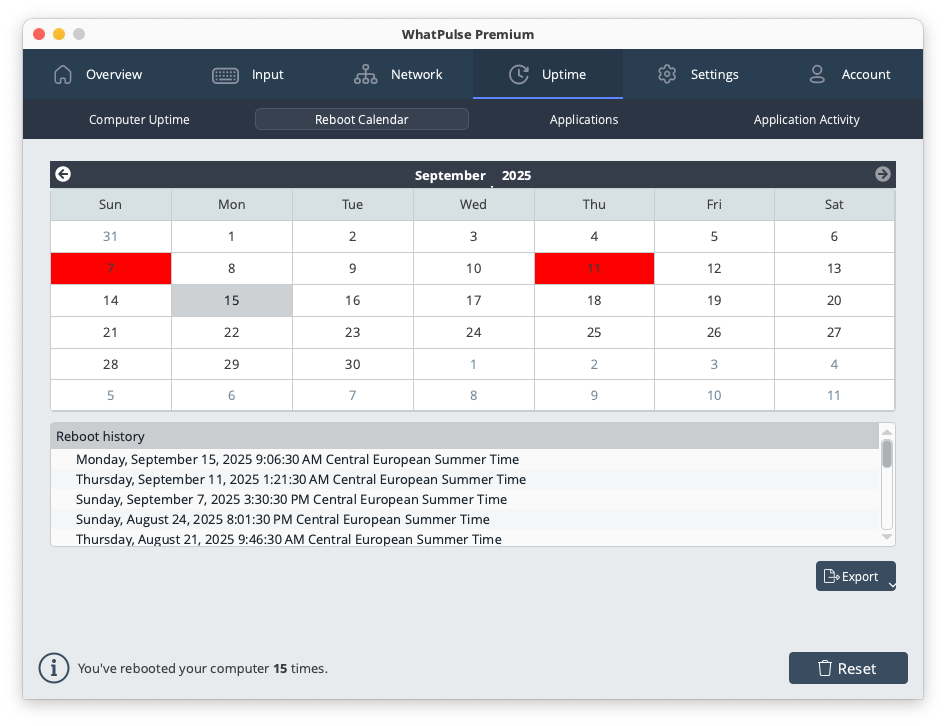
Next, the Reboot Calendar tab gives you a look at your reboot history in calendar form, so you can easily see which days your computer was rebooted. Plus, you can use the Export button to save your reboot details in CSV format.

Applications
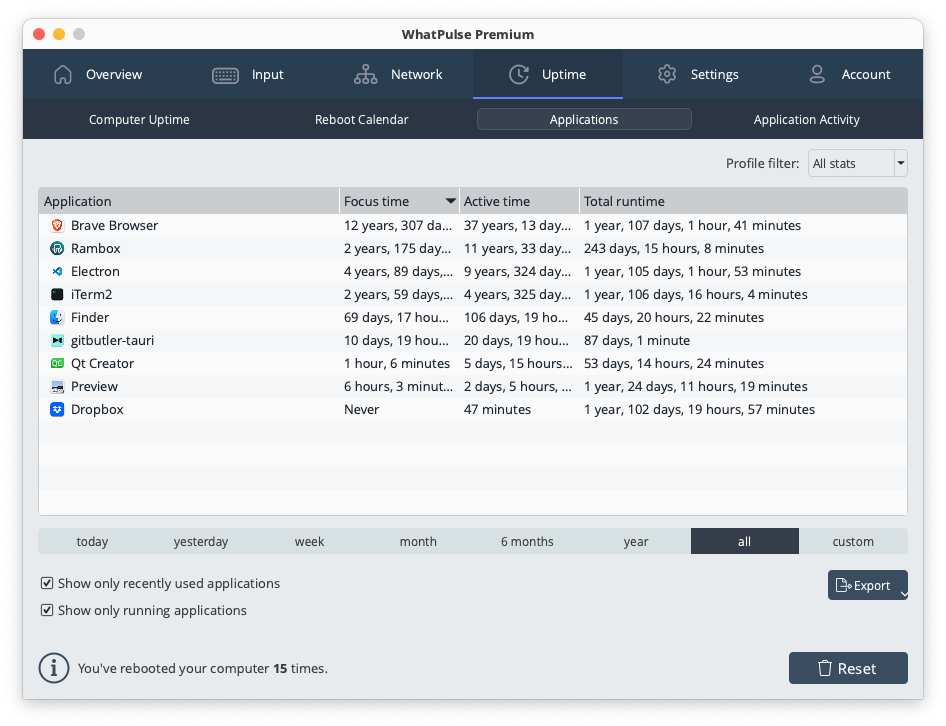
This tab provides you information about the total uptime of each application you have used on your computer, including total run time (active in the background) and total active time (when the app was in use).

Application Activity
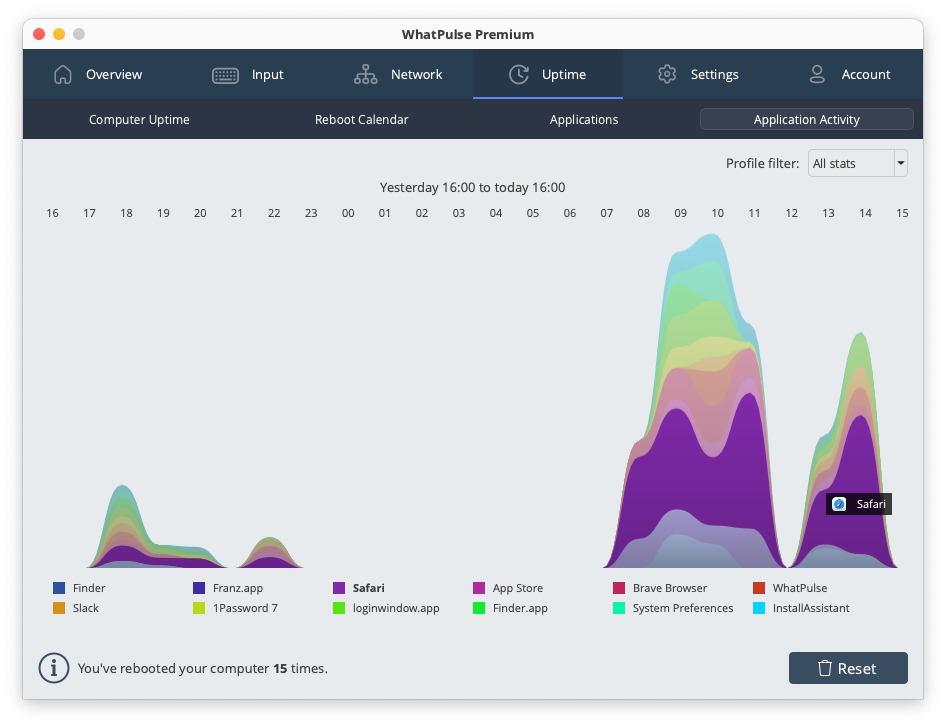
Finally, the Application Activity tab gives you a comparative view of your app usage with a colored graph. This can help you see which apps you're using the most and how they stack up against each other.

You can reset all your Uptime-related data using the Reset button.