About Widgets
A widget is a movable, resizable module that you can configure to show data in the form of text, bar charts, line charts, pie charts and heat-maps.
What is a chart widget? A chart widget is a fully customisable module that can show your data in the form of charts or graphs. There are a few different types of charts that you can choose from.
Bar Chart
Bar charts can show your daily, weekly, or monthly totals of keys, clicks, download, upload or uptime. You can choose between displaying keys, clicks, download, upload or uptime by clicking on the toggles below the chart.

Line Chart
Line charts can be created in two different formats. Ranking charts show your daily rankings over the past month. You can choose between displaying keys, clicks, download, upload or uptime by clicking on the toggles below the chart.
Total Stats charts show your cumulative totals between keys, clicks, download, upload or uptime. You can choose between displaying keys, clicks, download, upload or uptime by clicking on the toggles below the chart.
Pie Chart
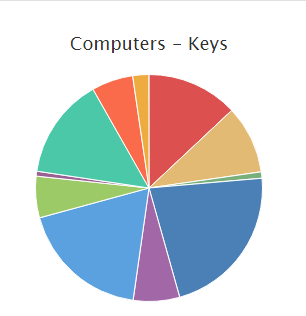
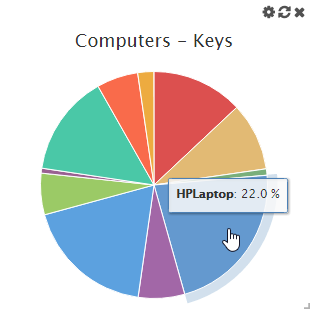
Pie charts show your total statistics as an overall percentage between computers. You can choose between displaying keys, clicks, download, upload or uptime upon creating or editing the chart. If you have multiple computers, this can let you visualize which computers you have used the most.
 or
or 
What is a text widget?
A text widget is a module that lets you display any information you like in a text-based format using variables. See Converting Text To Statistics for more information.
What is a Heat-map?
A heat-map is an image that shows more detailed information on how you use your keyboard or mouse.
Keyboard heat*maps show the frequency of each key you press. They are colour coded. "Hotter" keys mean that they have been pressed more.
Mouse heat-maps show the areas that you click on your screen the most. "Hotter" areas appear in spots that you click your mouse more frequently.